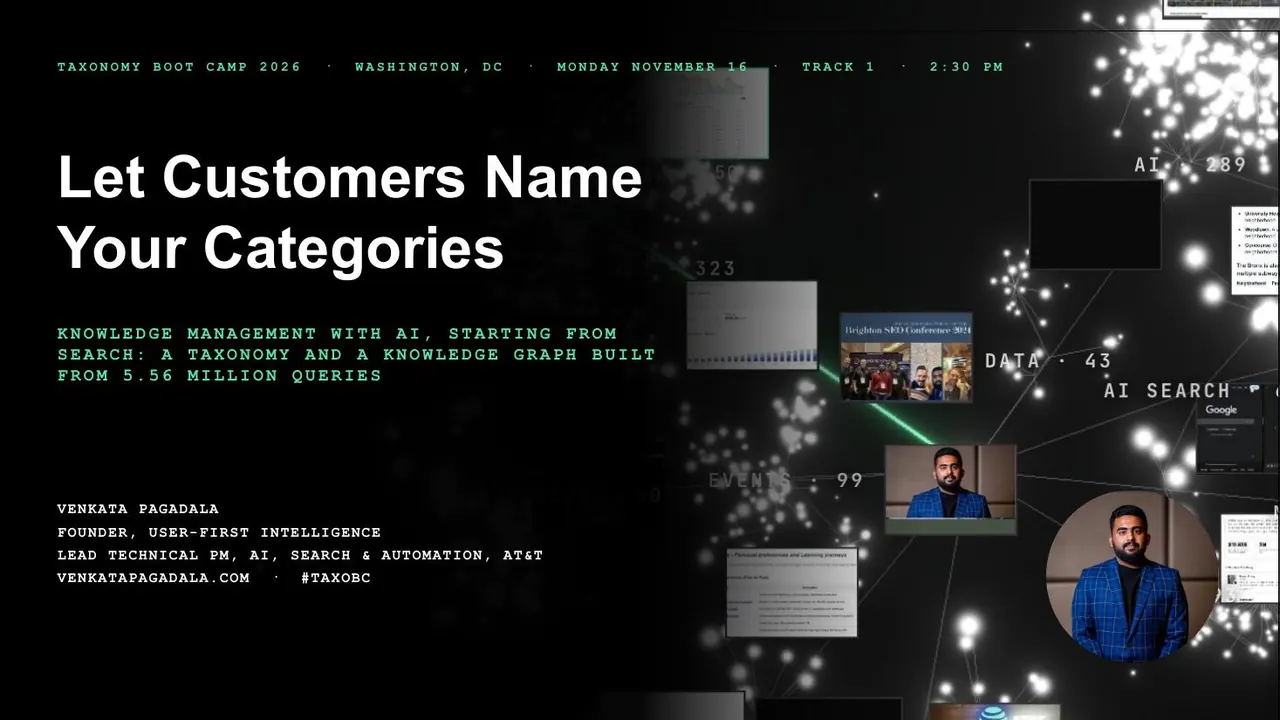
Taxonomy Boot Camp 2026 · Washington, DC · Track 1: Taxonomy Fundamentals · Nov 16, 2026, 2:30 PM
Let Customers Name Your Categories
Building a Taxonomy From Search Queries
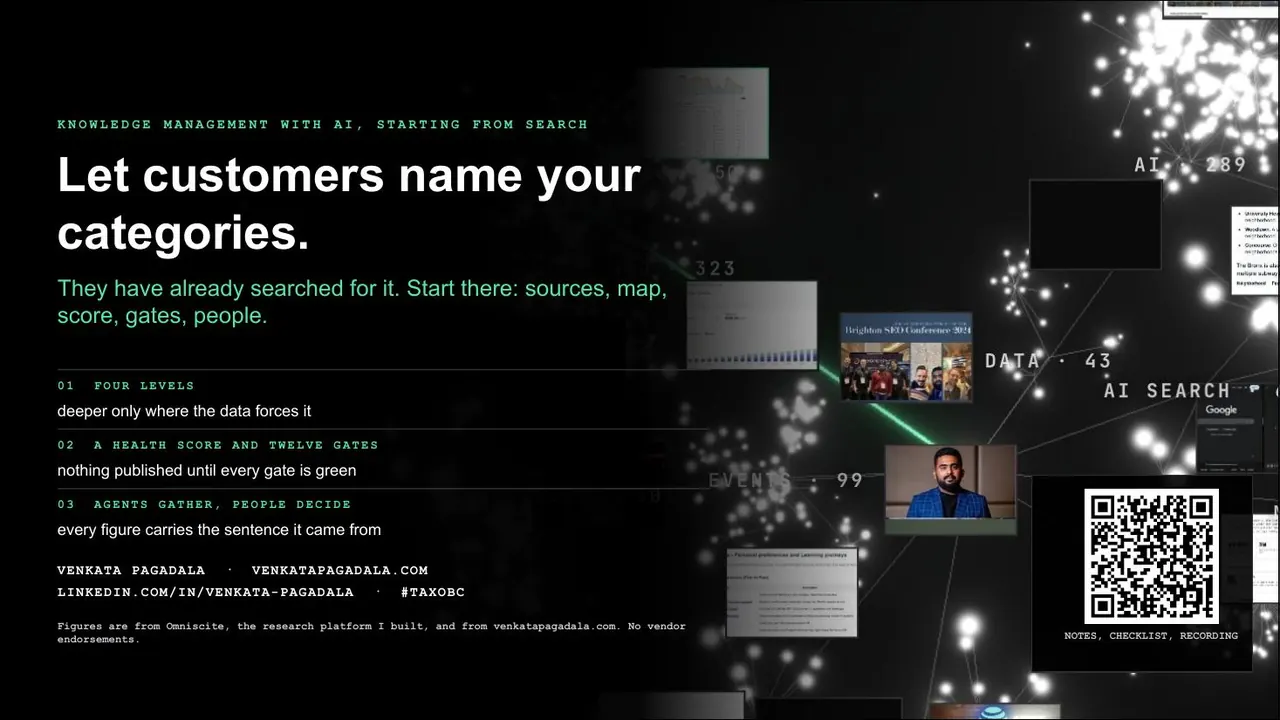
The words customers type into a search box show what they need, in their own language. This talk walks through how millions of real searches became categories, how the names came from customers' words, how many levels the taxonomy needed, one simple quality score, and where automation can take over the sorting. It ends with an eight-step checklist you can start this week.
No need to take notes: the video, every slide, the checklist and the full transcript are on this page. Nothing to sign up for.
Video
A 13-minute walkthrough of the talk, recorded on the morning of the session. Captions are in the player (CC). The full transcript is below, and your browser can translate it.
All 61 slides as images
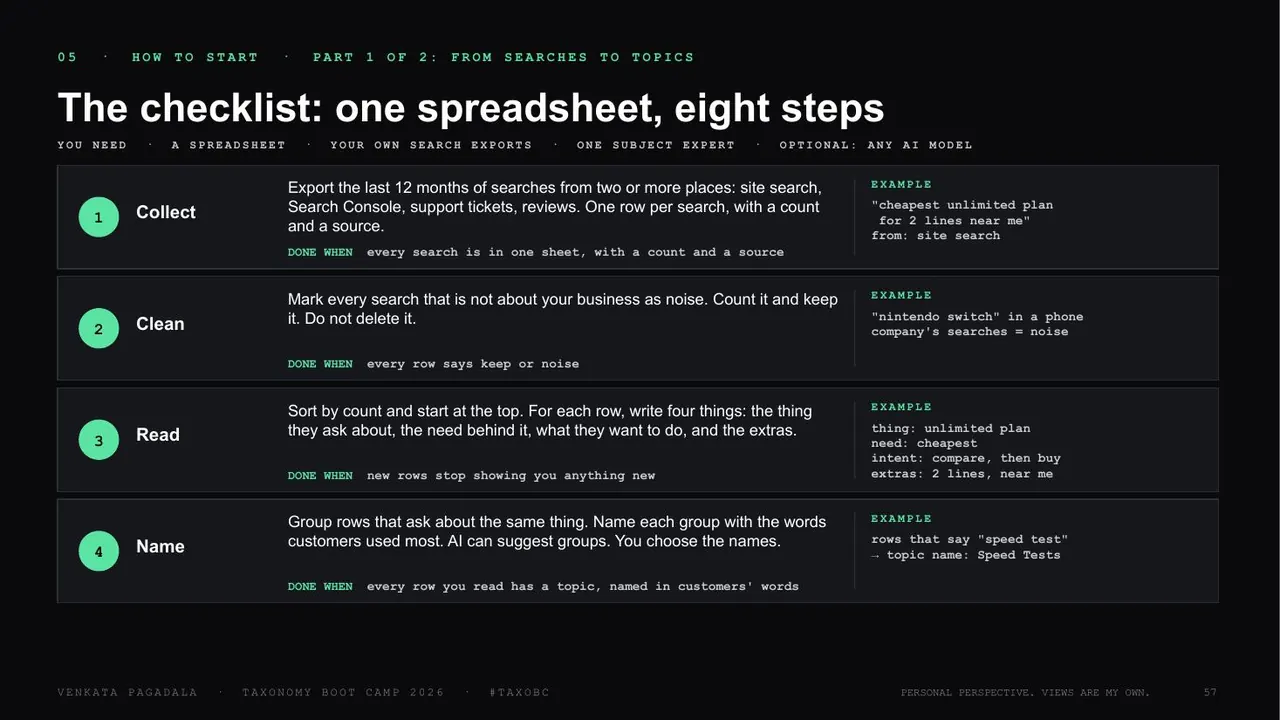
The checklist: one spreadsheet, eight steps
You need a spreadsheet, your own search exports and one subject expert. Any AI model is optional.
01Collect
Export the last 12 months of searches from two or more places: site search, Search Console, support tickets, reviews. One row per search, with a count and a source.
DONE WHENevery search is in one sheet, with a count and a source
Example
"cheapest unlimited plan for 2 lines near me"
from: site search
02Clean
Mark every search that is not about your business as noise. Count it and keep it. Do not delete it.
DONE WHENevery row says keep or noise
Example
"nintendo switch" in a phone company's searches = noise
03Read
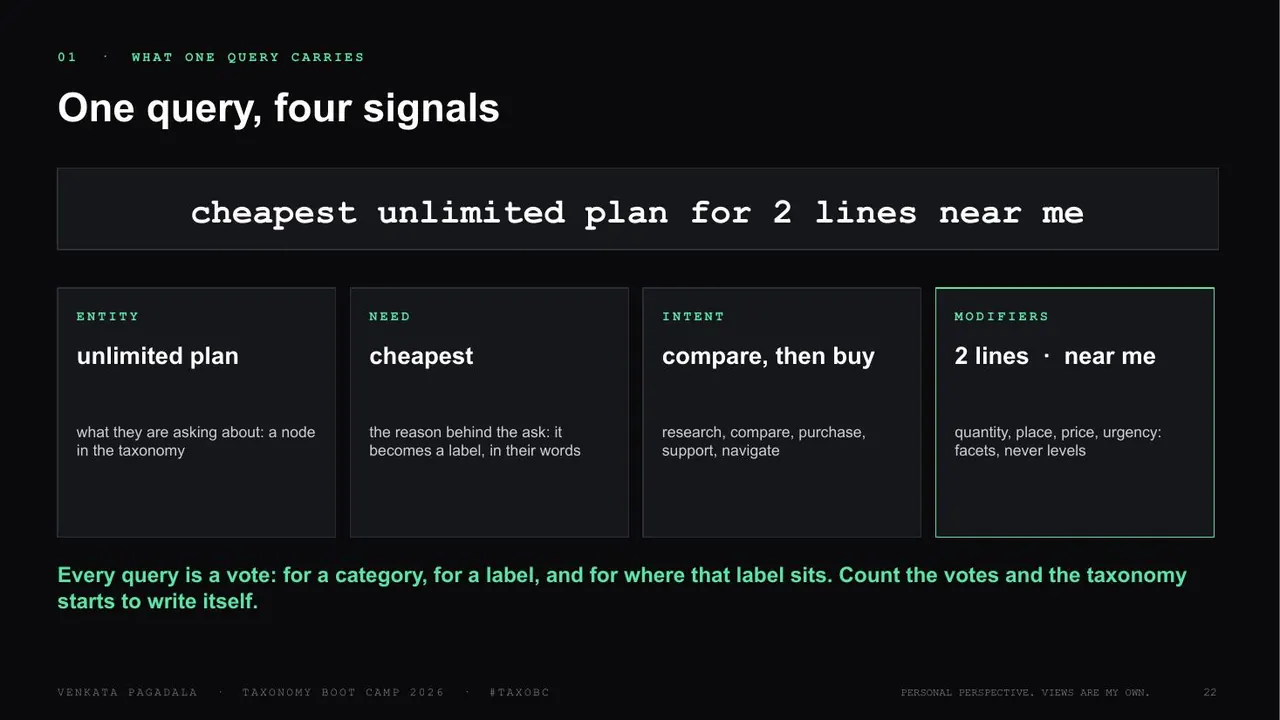
Sort by count and start at the top. For each row, write four things: the thing they ask about, the need behind it, what they want to do, and the extras.
DONE WHENnew rows stop showing you anything new
Example
thing: unlimited plan
need: cheapest
intent: compare, then buy
extras: 2 lines, near me
04Name
Group rows that ask about the same thing. Name each group with the words customers used most. AI can suggest groups. You choose the names.
DONE WHENevery row you read has a topic, named in customers' words
Example
rows that say "speed test"
topic name: Speed Tests
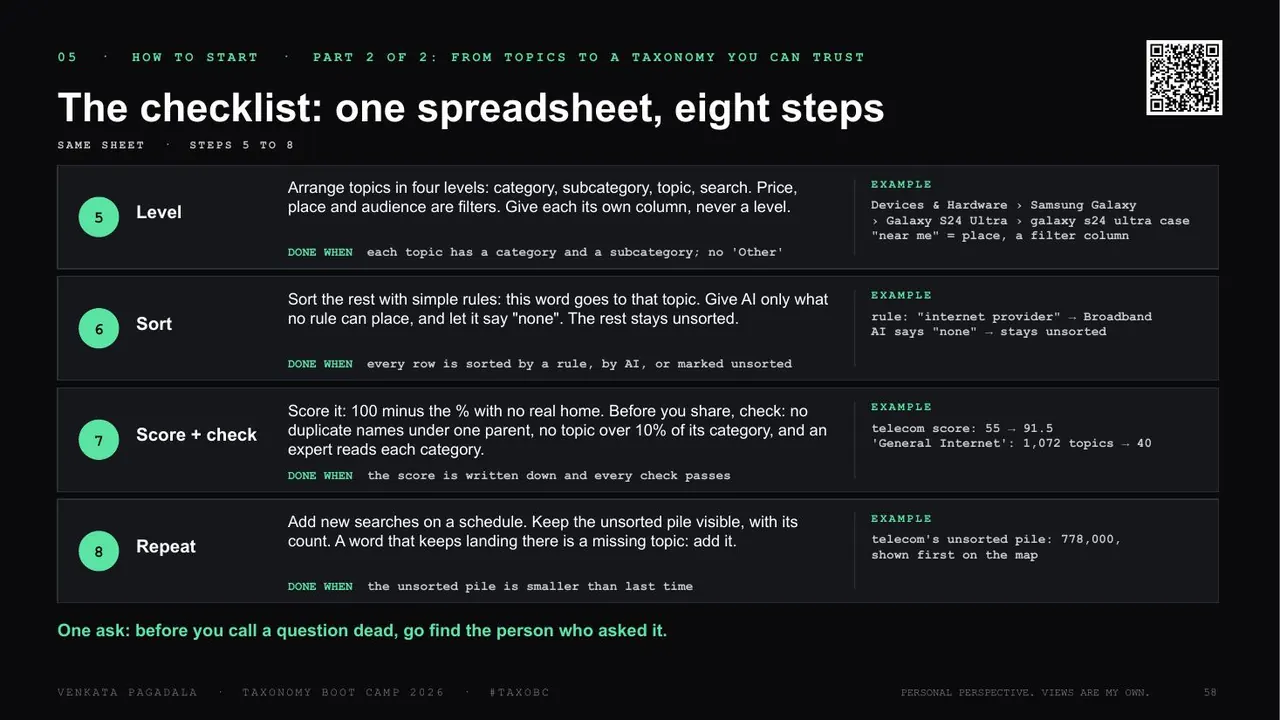
05Level
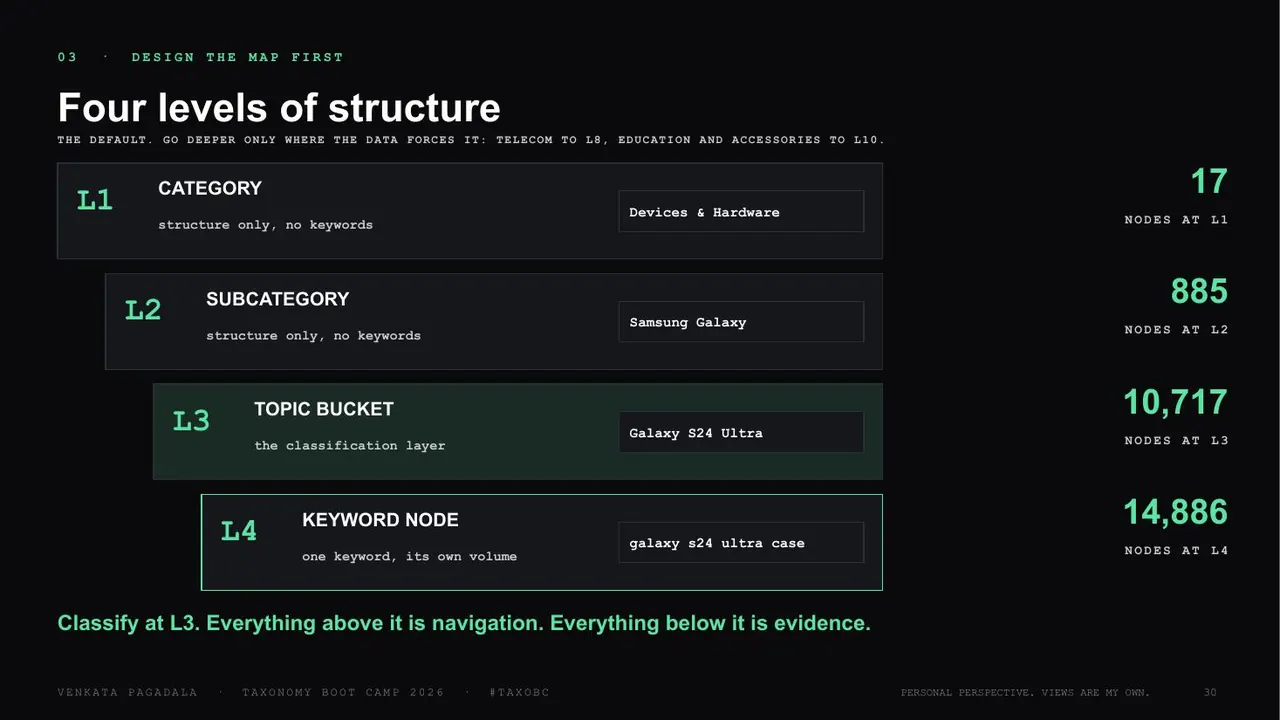
Arrange topics in four levels: category, subcategory, topic, search. Price, place and audience are filters. Give each its own column, never a level.
DONE WHENeach topic has a category and a subcategory; no 'Other'
Example
Devices & Hardware › Samsung Galaxy › Galaxy S24 Ultra › galaxy s24 ultra case
"near me" = place, a filter column
06Sort
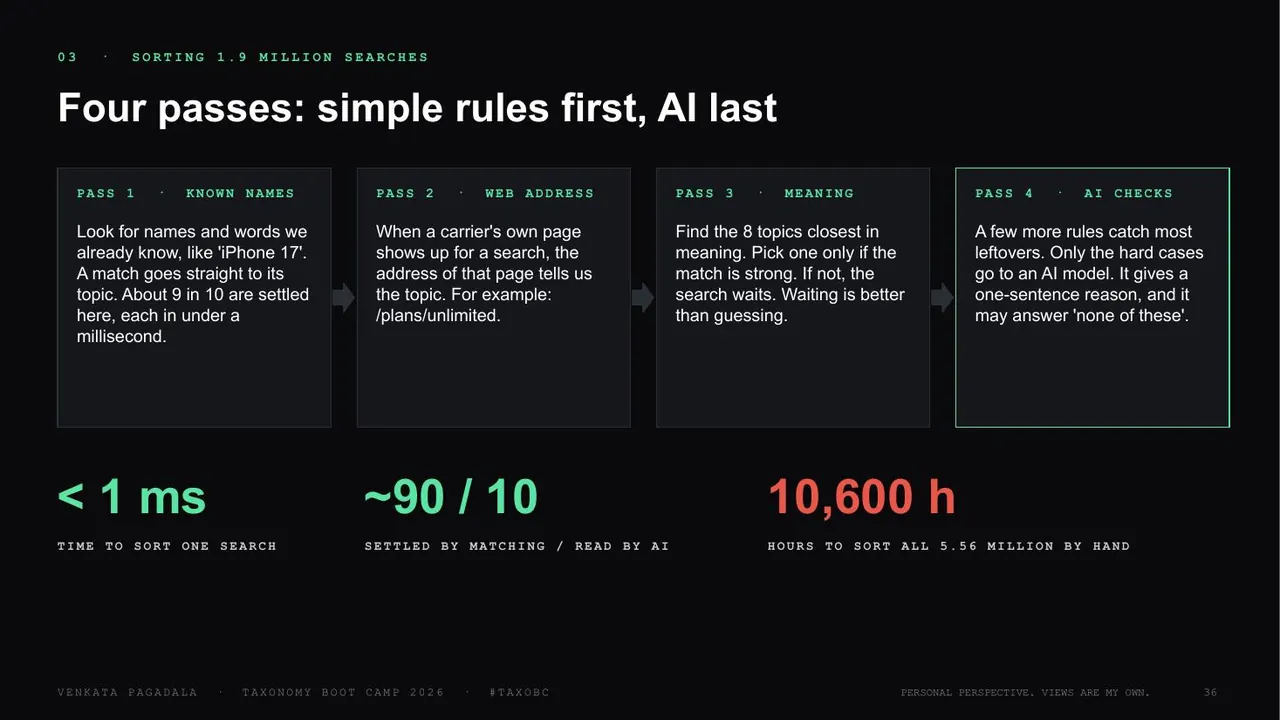
Sort the rest with simple rules: this word goes to that topic. Give AI only what no rule can place, and let it say "none". The rest stays unsorted.
DONE WHENevery row is sorted by a rule, by AI, or marked unsorted
Example
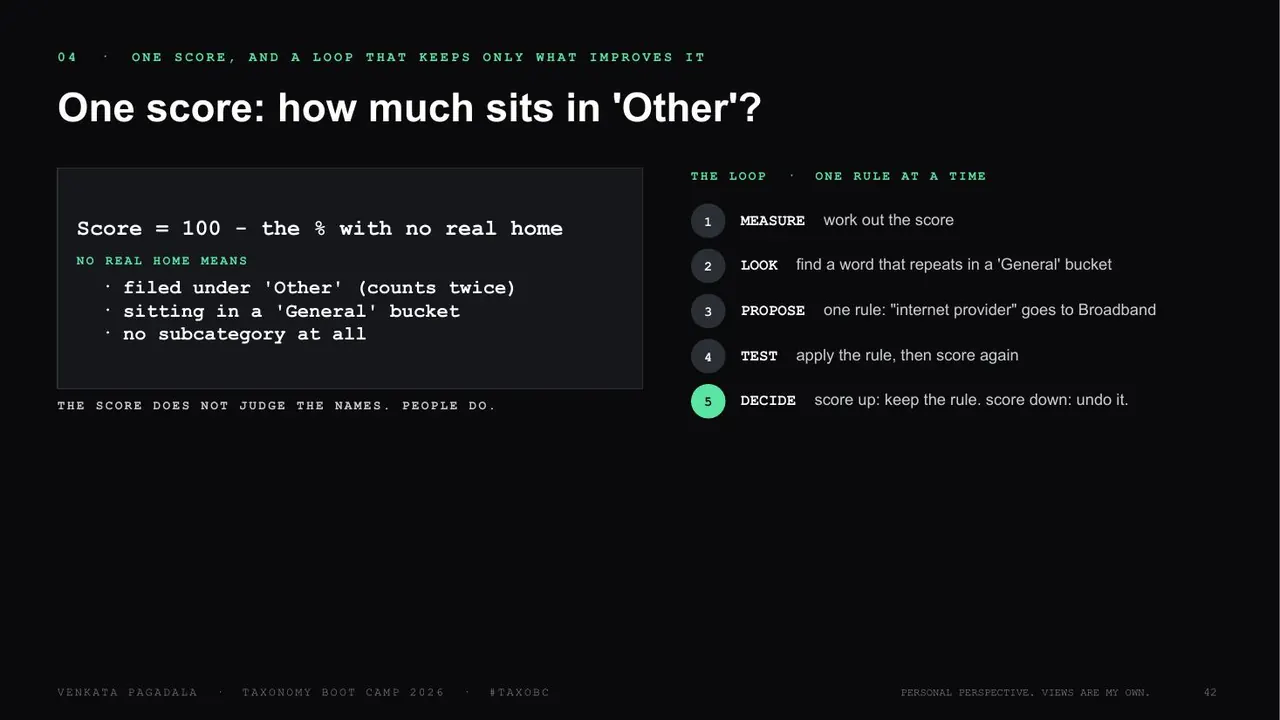
rule: "internet provider" → Broadband
AI says "none" → stays unsorted
07Score + check
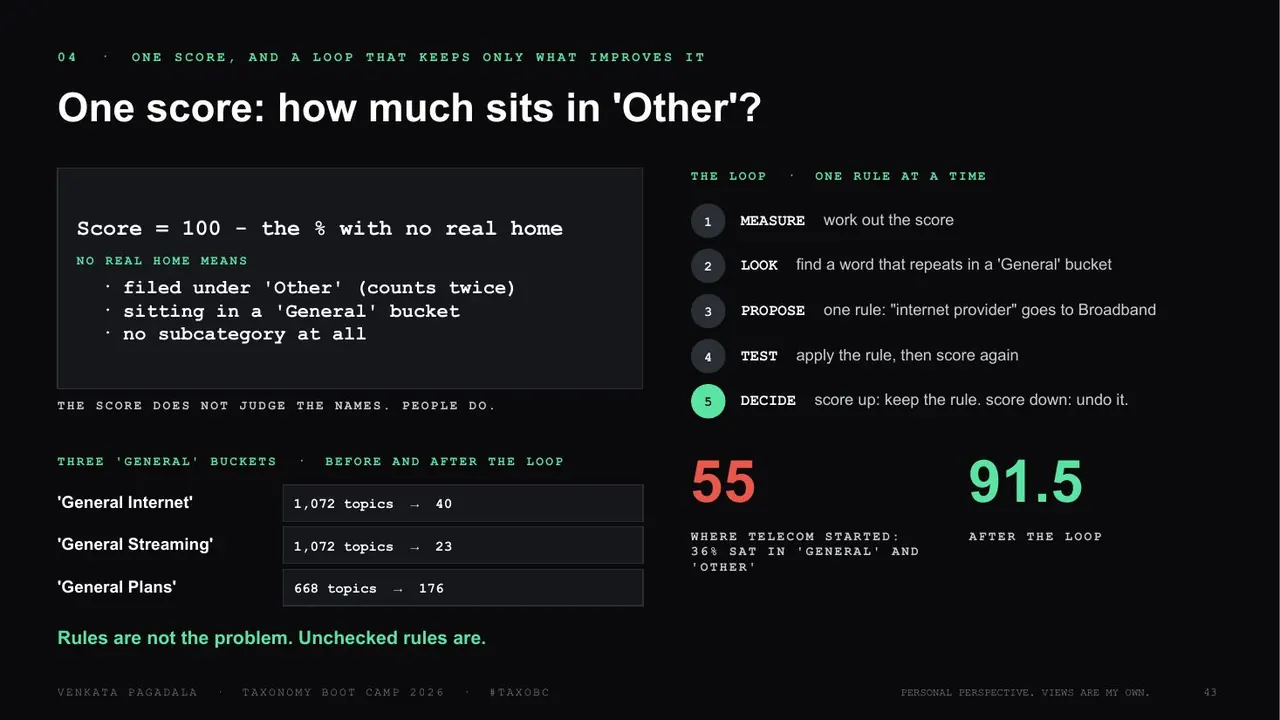
Score it: 100 minus the % with no real home. Before you share, check: no duplicate names under one parent, no topic over 10% of its category, and an expert reads each category.
DONE WHENthe score is written down and every check passes
Example
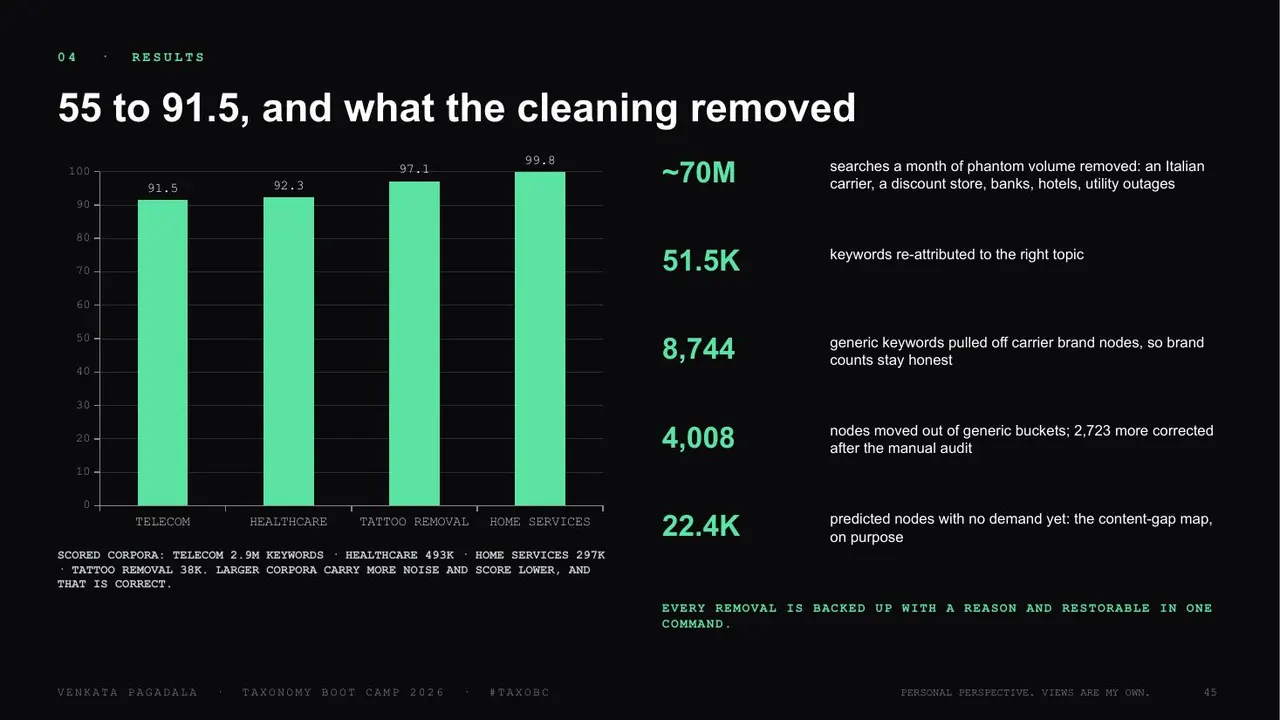
telecom score: 55 → 91.5
'General Internet': 1,072 topics → 40
08Repeat
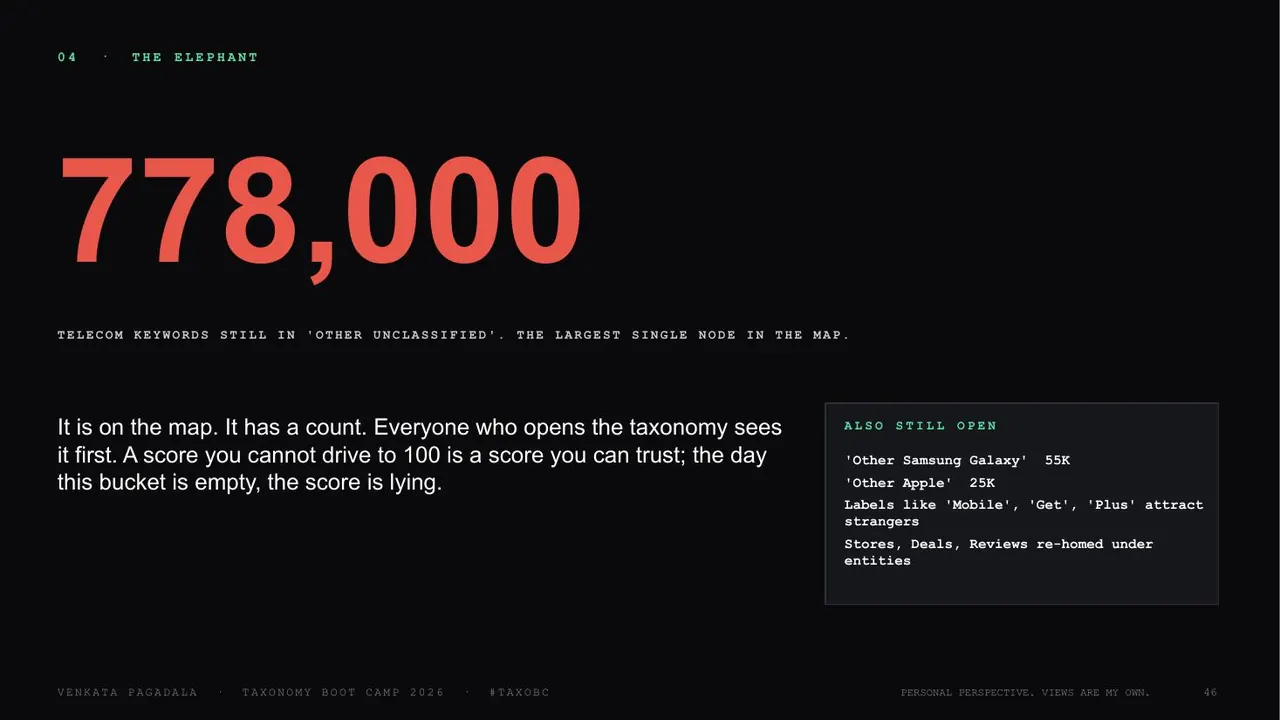
Add new searches on a schedule. Keep the unsorted pile visible, with its count. A word that keeps landing there is a missing topic: add it.
DONE WHENthe unsorted pile is smaller than last time
Example
telecom's unsorted pile: 778,000, shown first on the map
One ask: before you call a question dead, go find the person who asked it.
Go deeper: this talk is step one
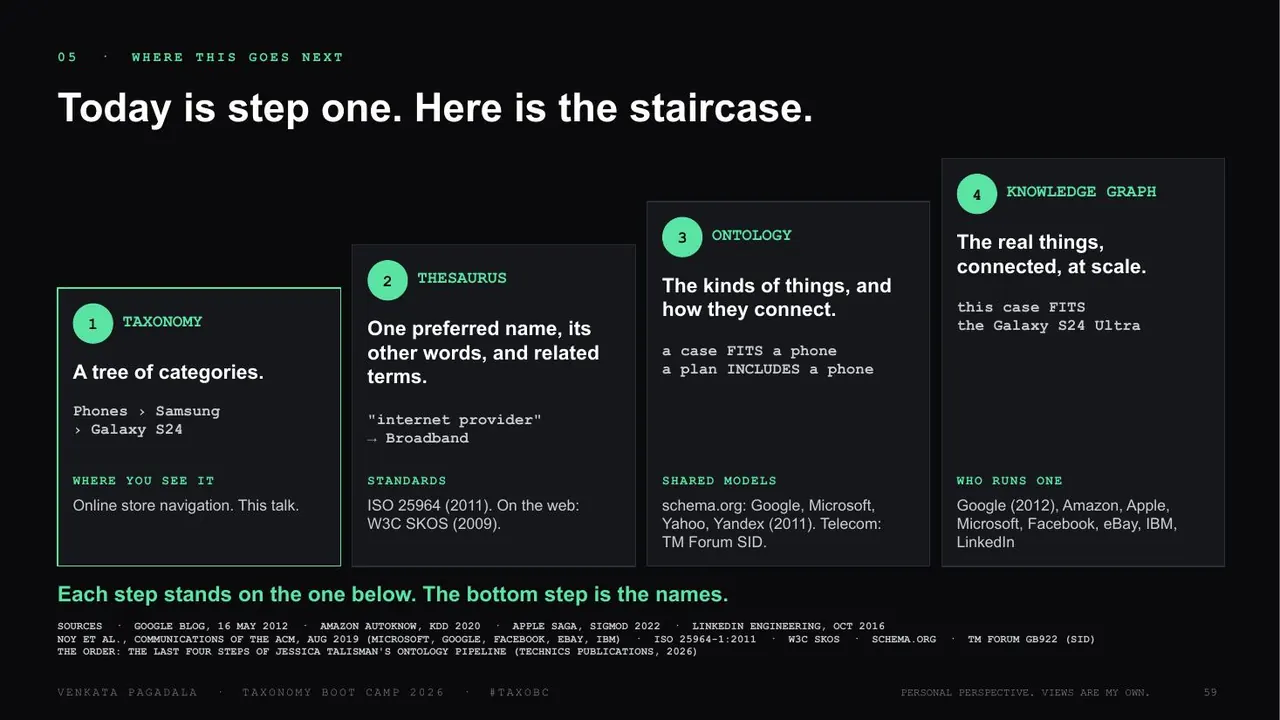
Each step stands on the one below, and the bottom step is the names. The order is the last four steps of Jessica Talisman's Ontology Pipeline.
Step 1
Taxonomy
A tree of categories.
Example: Phones › Samsung › Galaxy S24
Online store navigation. This talk.
Step 2
Thesaurus
One preferred name, its other words, and related terms.
Example: "internet provider" → Broadband
Standards: ISO 25964 (2011). On the web: W3C SKOS (2009).
Step 3
Ontology
The kinds of things, and how they connect.
Example: a case FITS a phone; a plan INCLUDES a phone
Shared models: schema.org (Google, Microsoft, Yahoo, Yandex, 2011). Telecom: TM Forum SID.
Step 4
Knowledge graph
The real things, connected, at scale.
Example: this case FITS the Galaxy S24 Ultra
Who runs one: Google (2012), Amazon, Apple, Microsoft, Facebook, eBay, IBM, LinkedIn.
Google, 16 May 2012 ↗Amazon AutoKnow, KDD 2020 ↗Apple Saga, SIGMOD 2022 ↗Noy et al., CACM 2019 ↗LinkedIn, Oct 2016 ↗
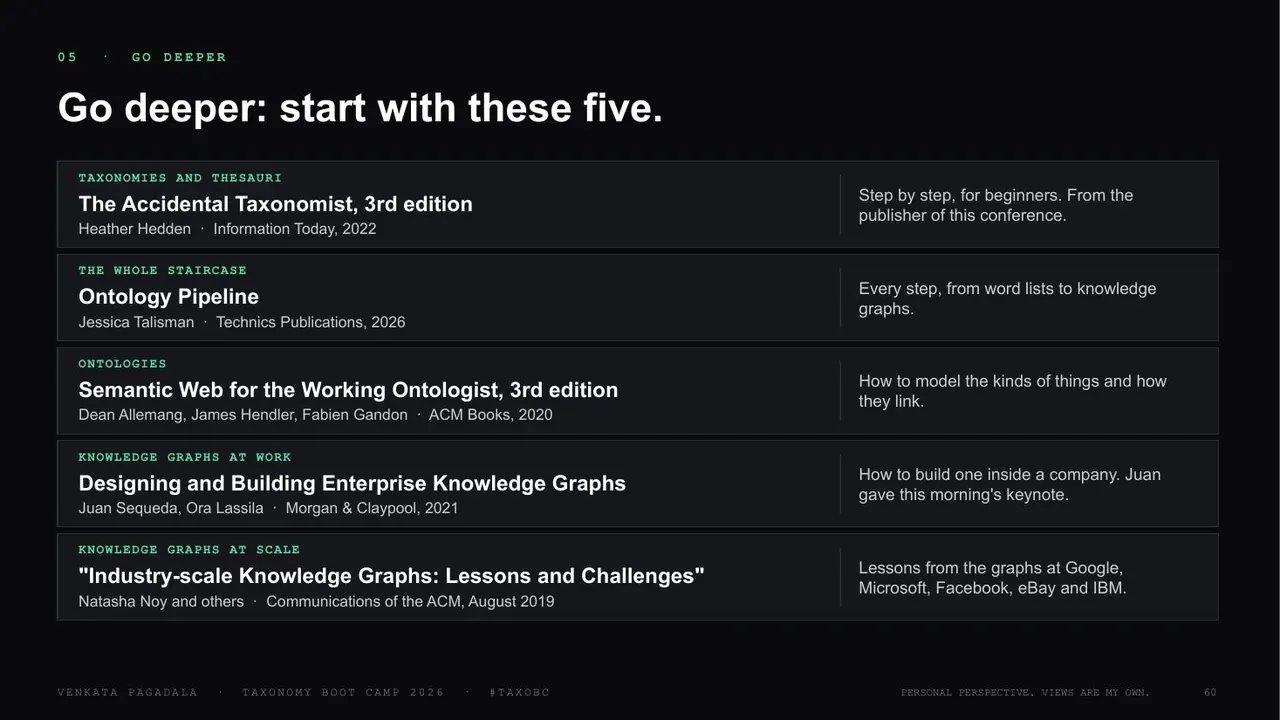
Five places to start reading
Taxonomies and thesauri
The Accidental Taxonomist, 3rd edition ↗Heather Hedden · Information Today, 2022
Step by step, for beginners. From the publisher of this conference.
Every step, from word lists to knowledge graphs.
Ontologies
Semantic Web for the Working Ontologist, 3rd edition ↗Dean Allemang, James Hendler, Fabien Gandon · ACM Books, 2020
How to model the kinds of things and how they link.
Knowledge graphs at work
Designing and Building Enterprise Knowledge Graphs ↗Juan Sequeda, Ora Lassila · Morgan & Claypool, 2021
How to build one inside a company.
Knowledge graphs at scale
Industry-scale Knowledge Graphs: Lessons and Challenges ↗Natasha Noy and others · Communications of the ACM, August 2019
Lessons from the graphs at Google, Microsoft, Facebook, eBay and IBM.
Transcript
1,788 words, timed to the video. Generated from the recording on my own machine and lightly edited for reading: punctuation, paragraphs and repeated words. Names and terms the slides show were corrected; the captions file keeps the spoken wording. 5 short passages that could not be made out are marked [unclear].
0:00A dinner at Old Ebbitt Grill
[0:00]Hey everyone, this is Venkata Pagadala. Today I'm at the Knowledge Management conference 2026, talking at Taxonomy Boot Camp. My subject today is Let Customers Name Your Categories. I'm going to explain it with real-time examples: the process, how to do it, the steps to avoid and the steps to follow. This is the foundational level of organizing knowledge, or data.
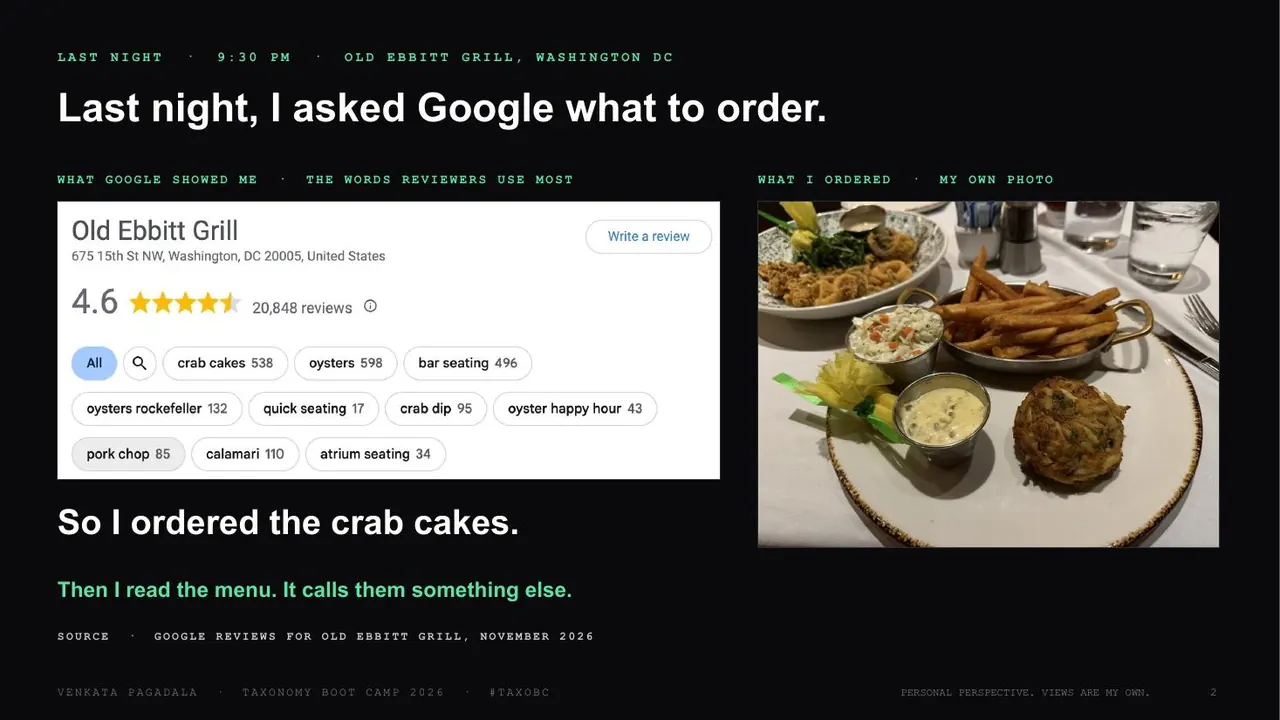
[0:21]I'm from Atlanta. I flew in on November 15, yesterday, which is my birthday as well, so I was looking for a great restaurant to have a nice dinner. I found a restaurant with 20,000 reviews, and it looked good. I was curious what options they have and what reviews customers are actually leaving. I found that people mention crab cakes, oysters and calamari, which are my favorites by the way, and that's what I ordered yesterday.
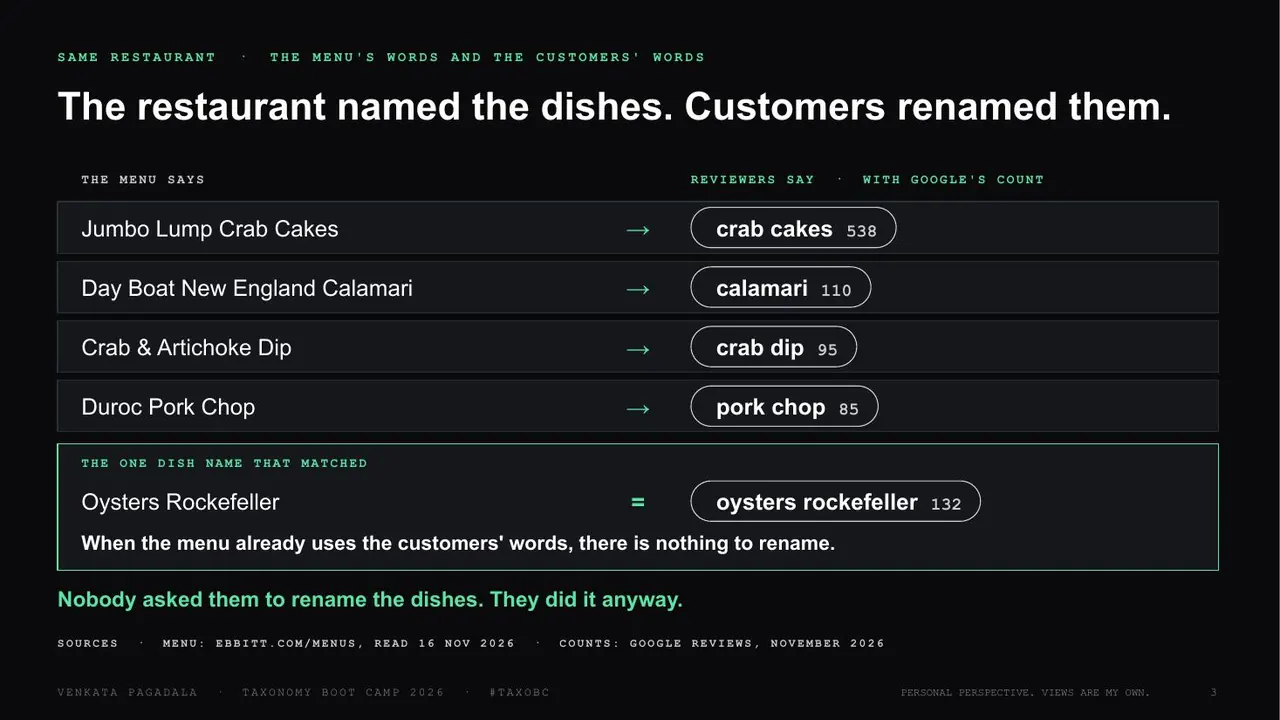
[0:58]So I was curious: what are the actual names the restaurant has, what are the customers referring to, and how is Google classifying this? If you look here, the actual names are different from the customer mentions, and the customer mentions are how Google is classifying them. The category can be the same, but you can see the difference between the customer mentions and the real names the restaurant has.
[1:28]That's pretty much my whole process: collecting data, classifying it and mapping it. How to do knowledge management is the whole subject of this presentation. By the way, I really love the calamari.
1:47Everything is on one page
[1:47]I'm going to put the notes, the transcripts, the slides, everything here, so you can follow the video. If you want anything downloadable, no email is required; you can access it directly.
1:59Your customers have already searched for you
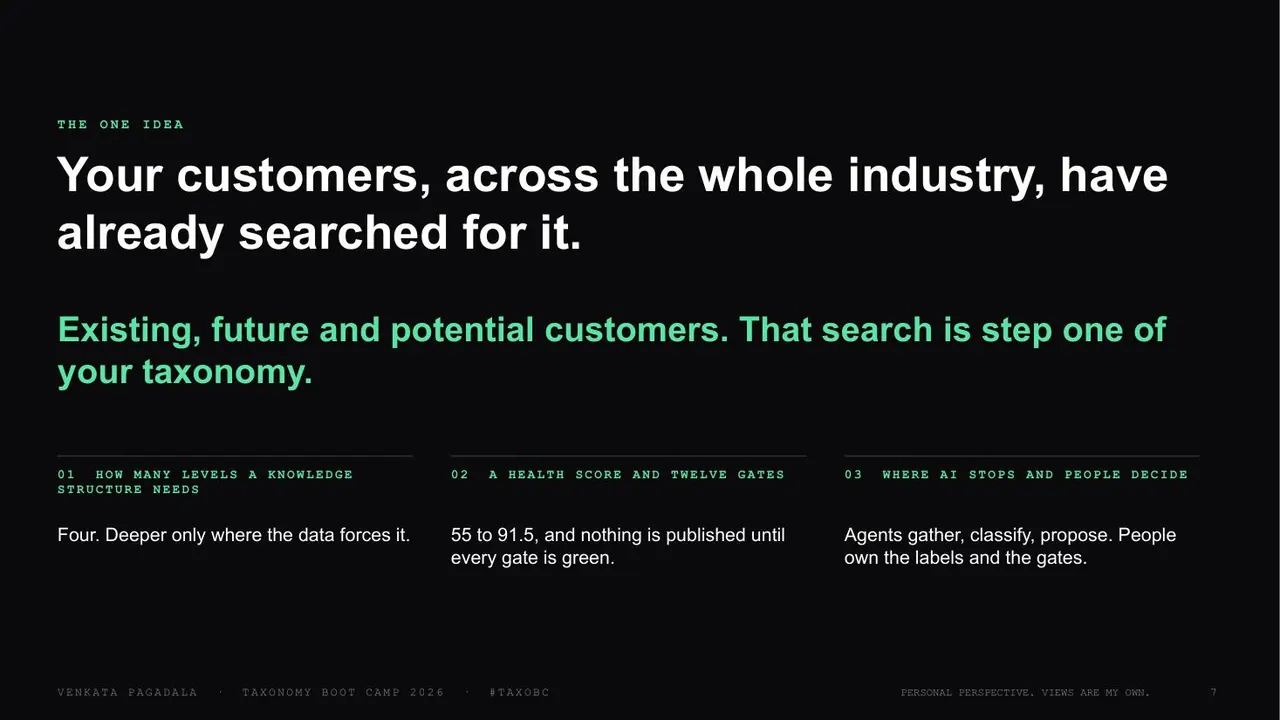
[1:59]Your customers, across the whole industry, have already searched for you. What I mean is that we are not trying to find new customers or new search patterns. One way or another, on one platform or another, your customers, future customers and potential customers have already searched for your product or service.
[2:23]So how can we collect that data? Which platforms do we need to collect it from, how do we classify it, and what are the common mistakes we make?
2:34Why graphs matter
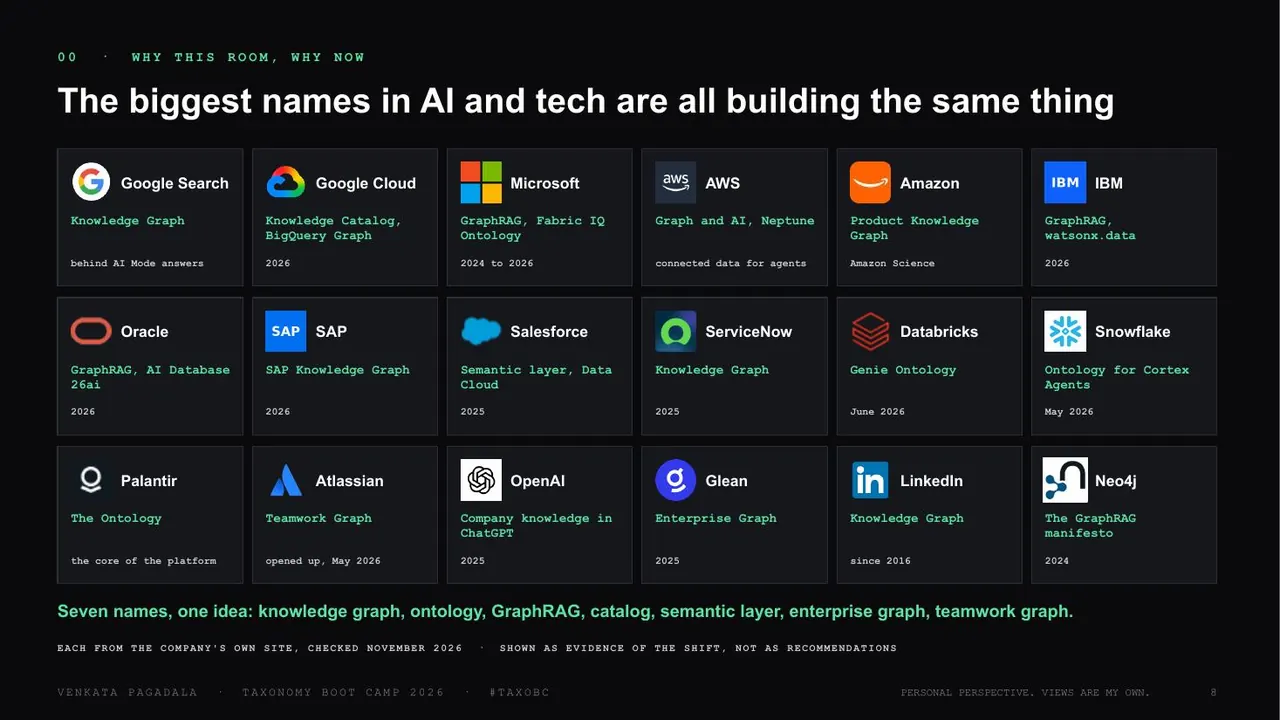
[2:34]Before jumping into the details and processes, I want to highlight the importance of the graphical relations in our data. If you look at Google, Microsoft, AWS, Amazon, IBM, Palantir and OpenAI, pretty much all the top companies are doing one common thing: graphical relations.
[2:53]Again, this is not something net new. If you go back maybe 20 or 30 years, everyone used to have a map of the address where they needed to go. Put simply: you have a bunch of data around you, and you map it in order to reach what you want. That's the foundational explanation of how graphical relations work in data, and it tells me how important they are.
3:33About me
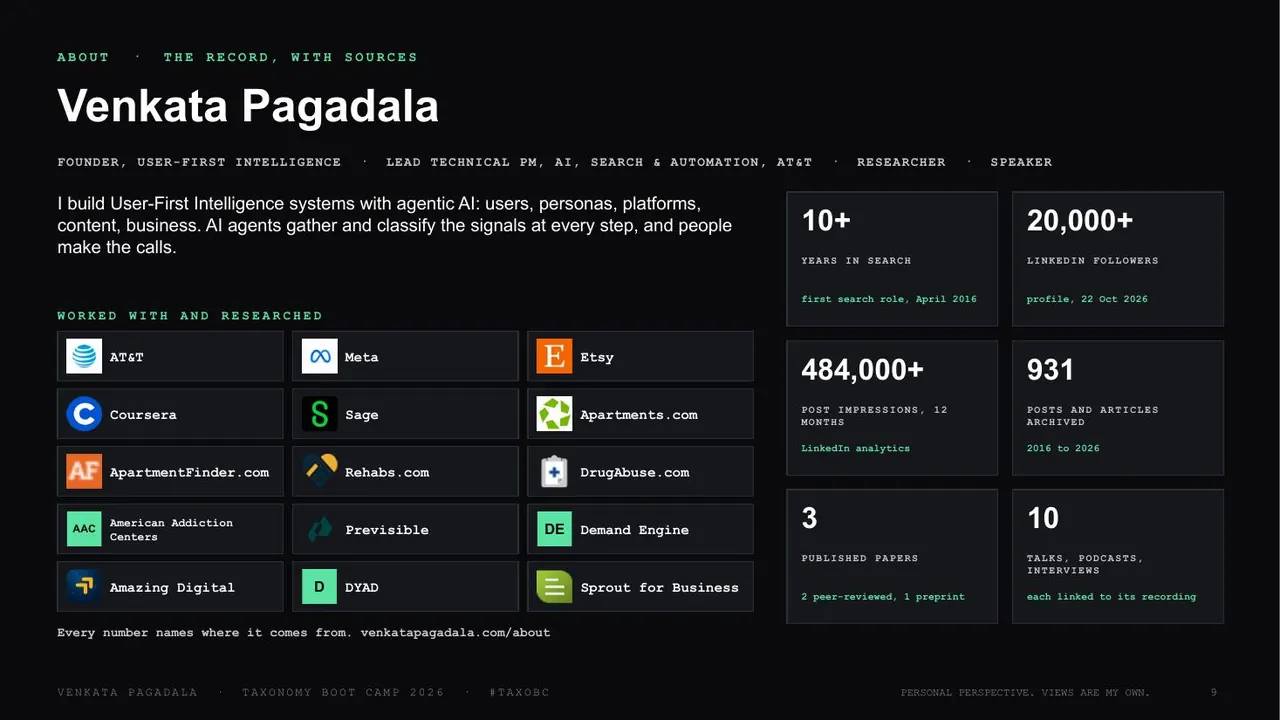
[3:33]So who am I, and what is my credibility to talk about this? Let me introduce myself: I'm Venkata Pagadala. I have worked in the search industry for more than a decade. I have worked with brands like AT&T, Apartments.com and rehabs.com, and researched with [unclear], Previsible, [unclear], Amazing Digital and [unclear]. I write research papers and look for new patterns. That's my credibility to talk today.
4:01How it started: the question every team asks
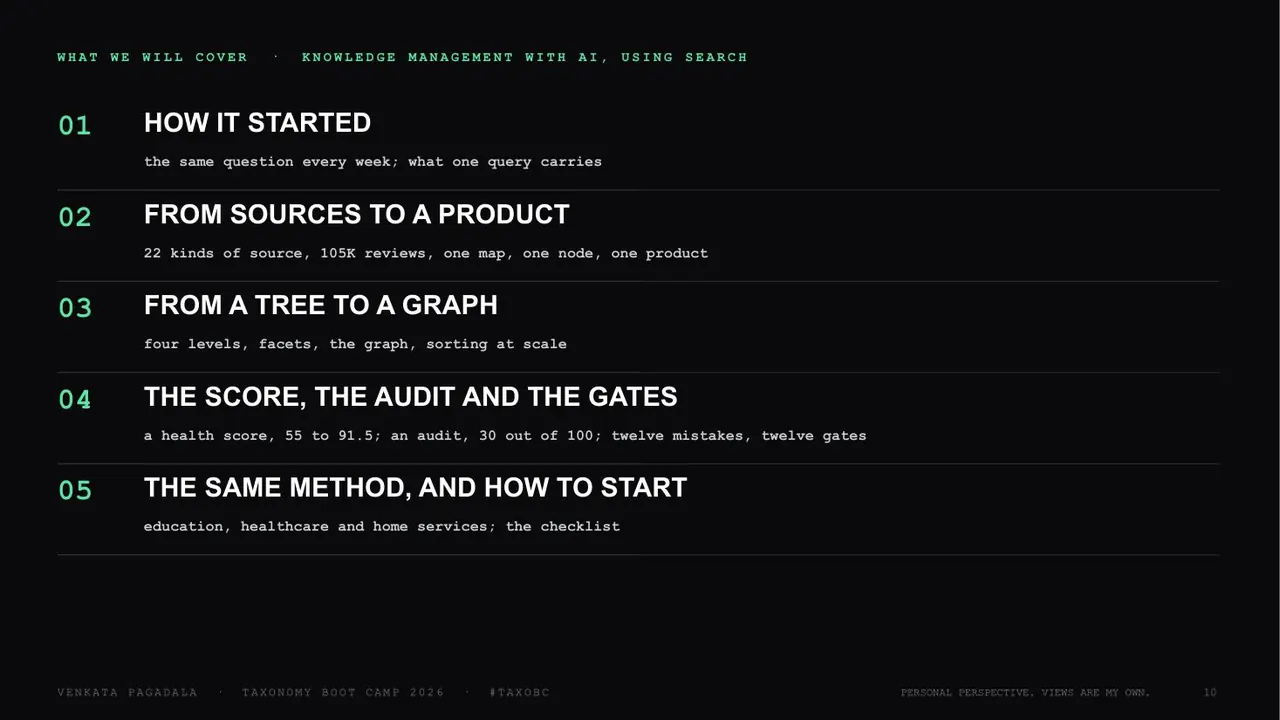
[4:01]So: how I started, how I found the sources, from source to product, from tree to graph, how I score it, and how to start.
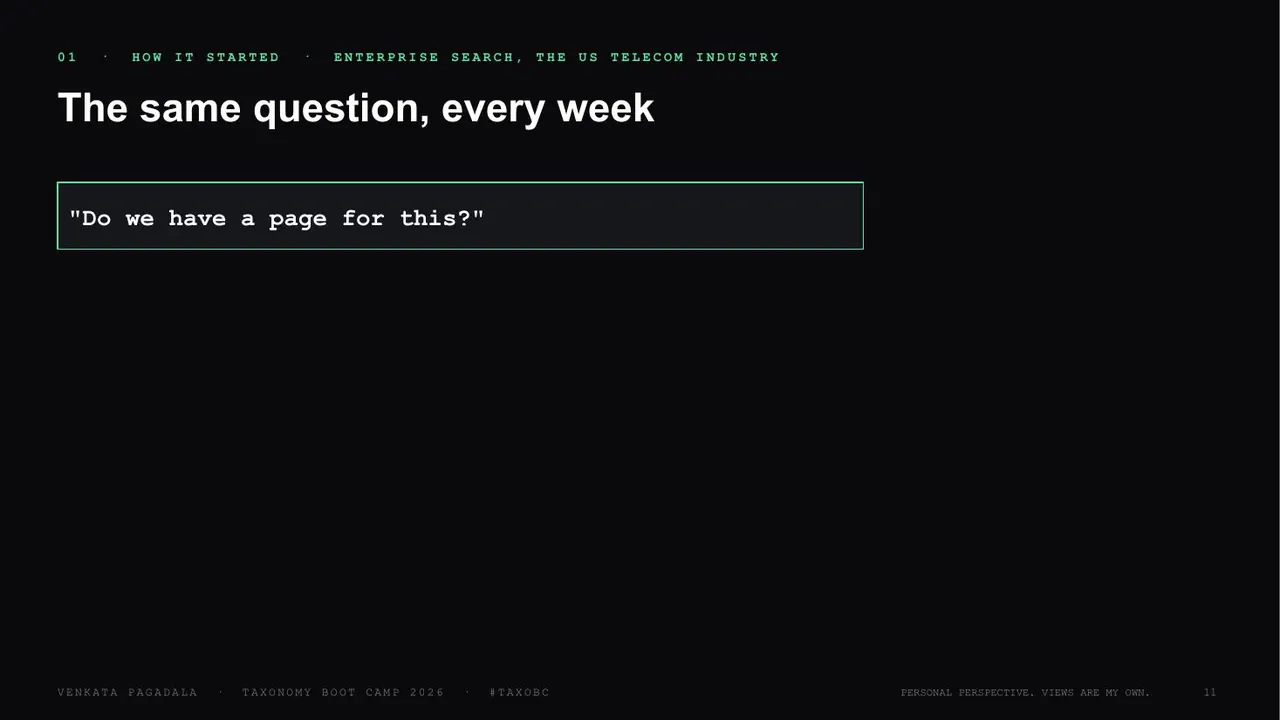
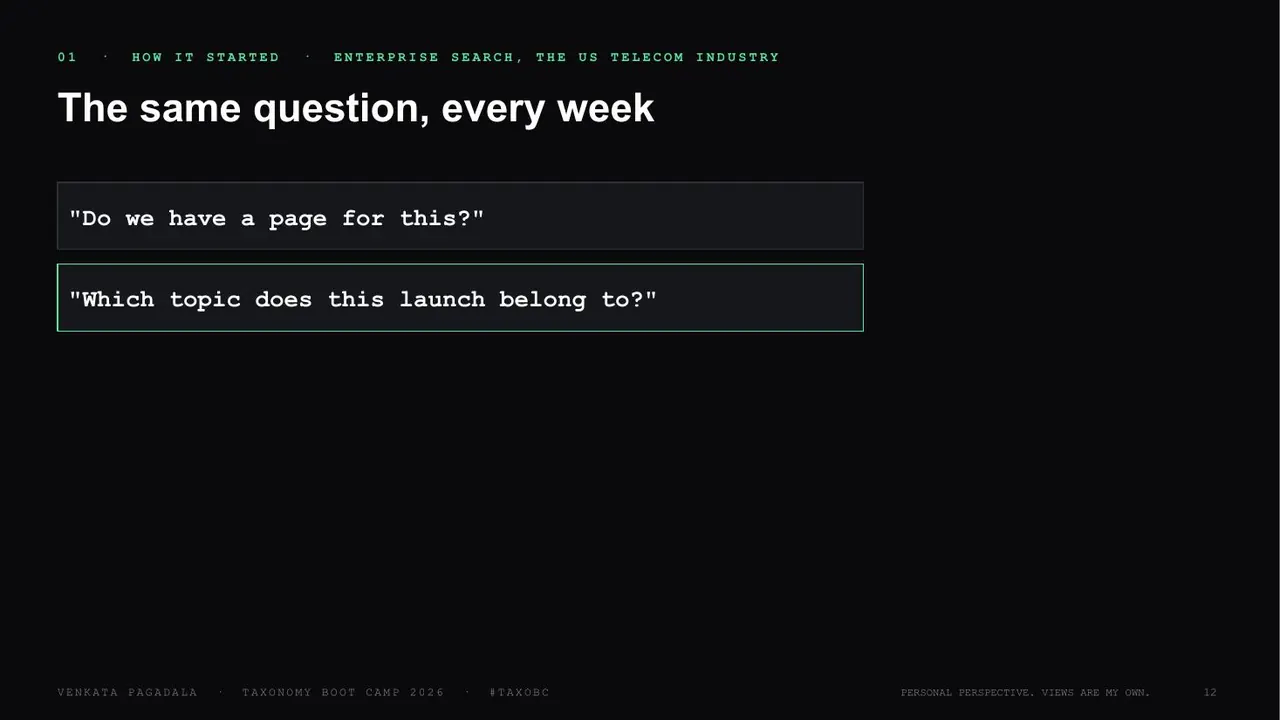
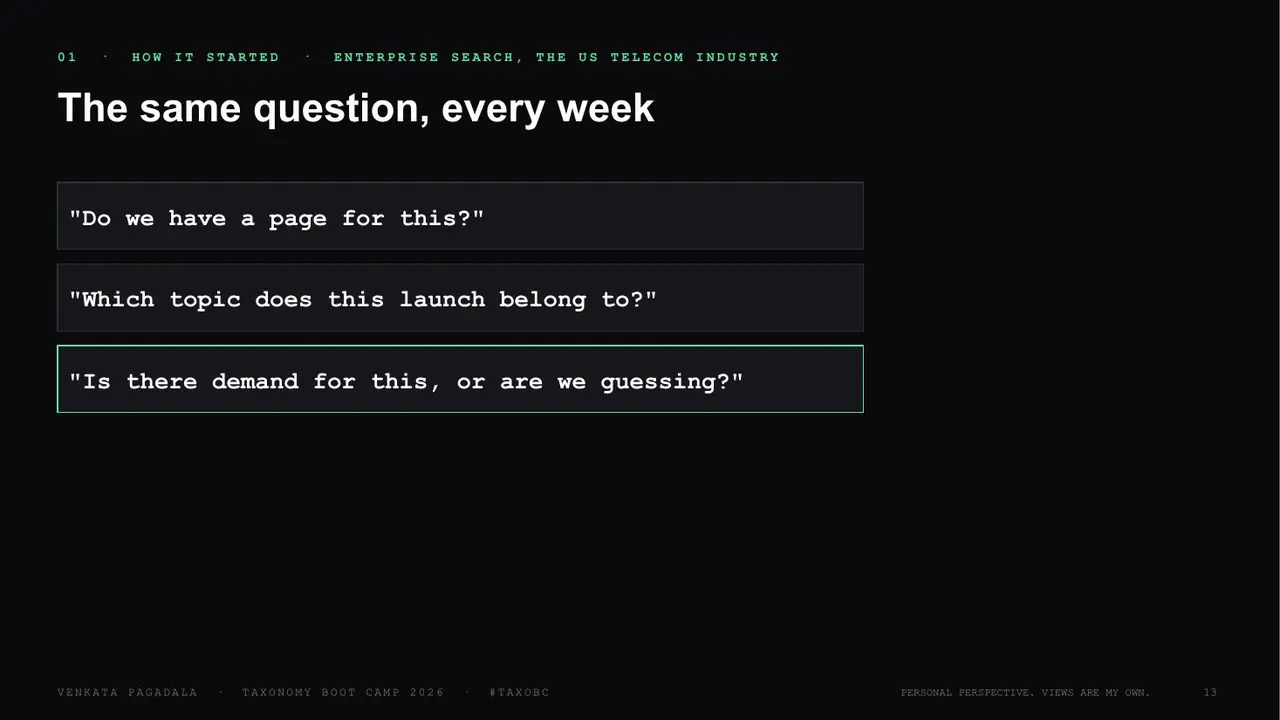
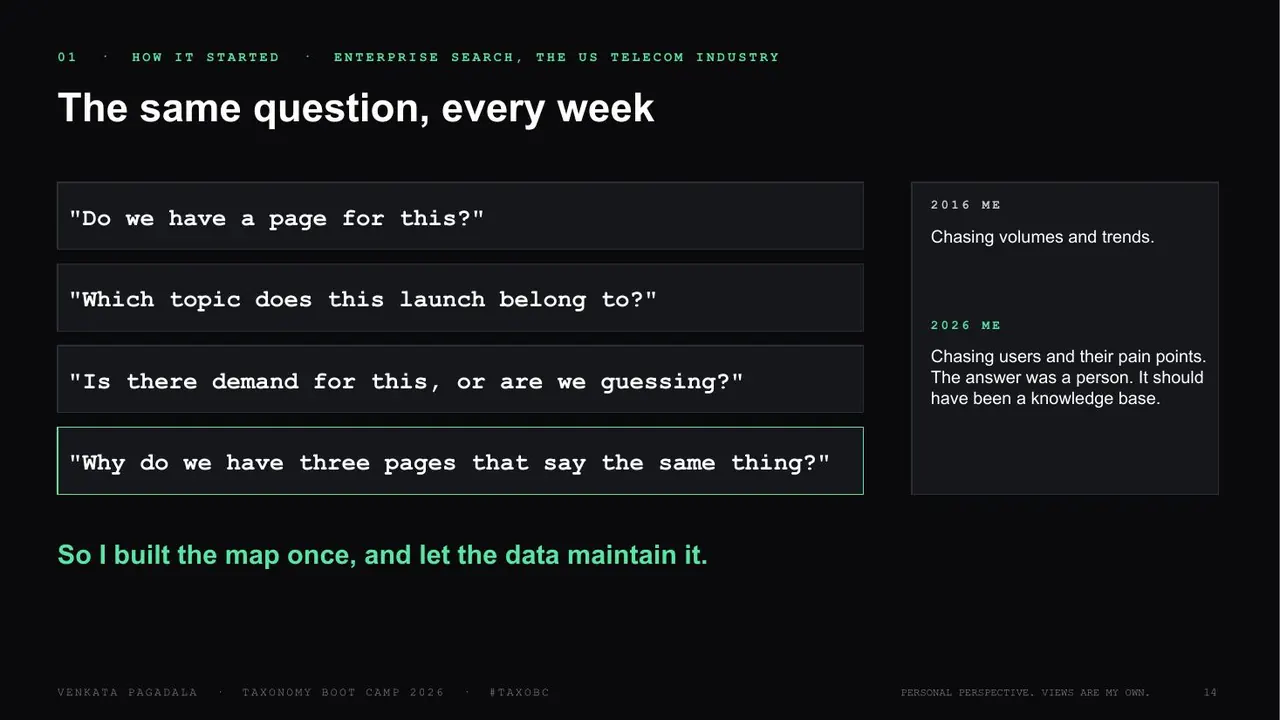
[4:13]Where did it start? I work in enterprise companies, where a lot of different teams work in parallel, and they ask one common question: do we have a page for this? Which topic does what we're launching belong to? Is there demand for it? Why do we have more pages on a specific topic: is it because of demand, or were they created by accident, by several teams that didn't know about each other? These are the questions I get from team members across the board, and sometimes from leadership as well.
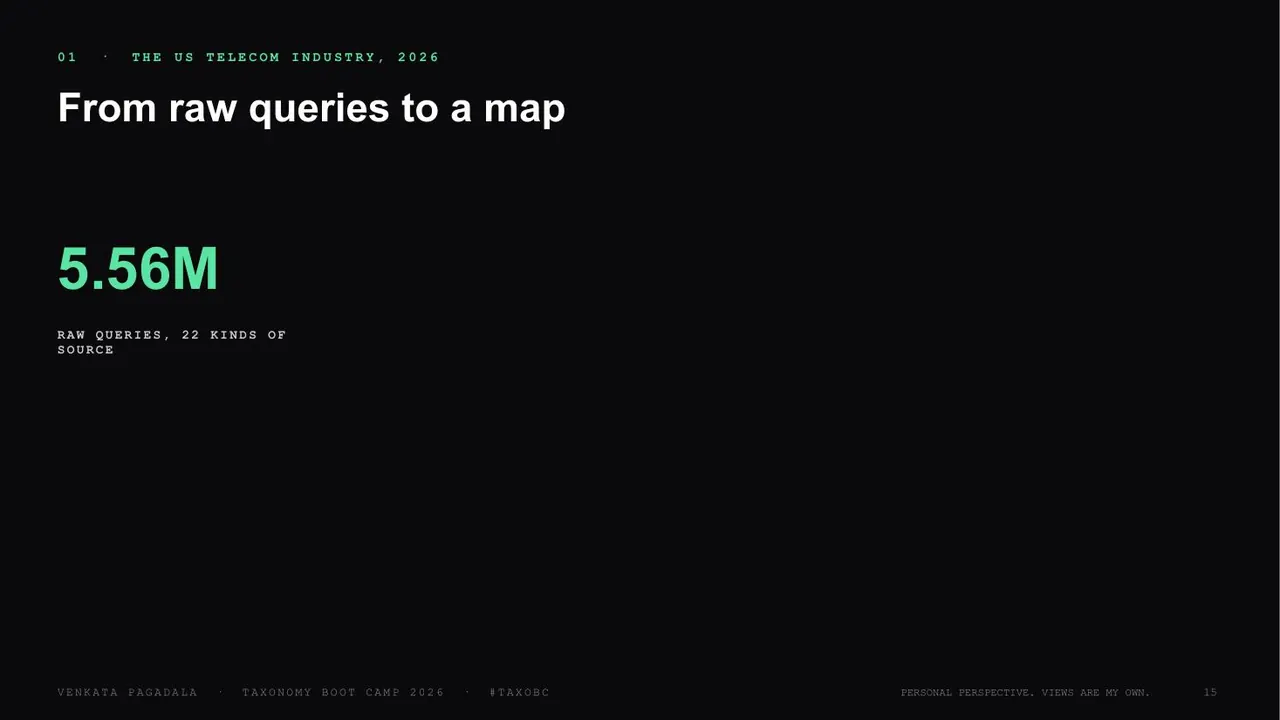
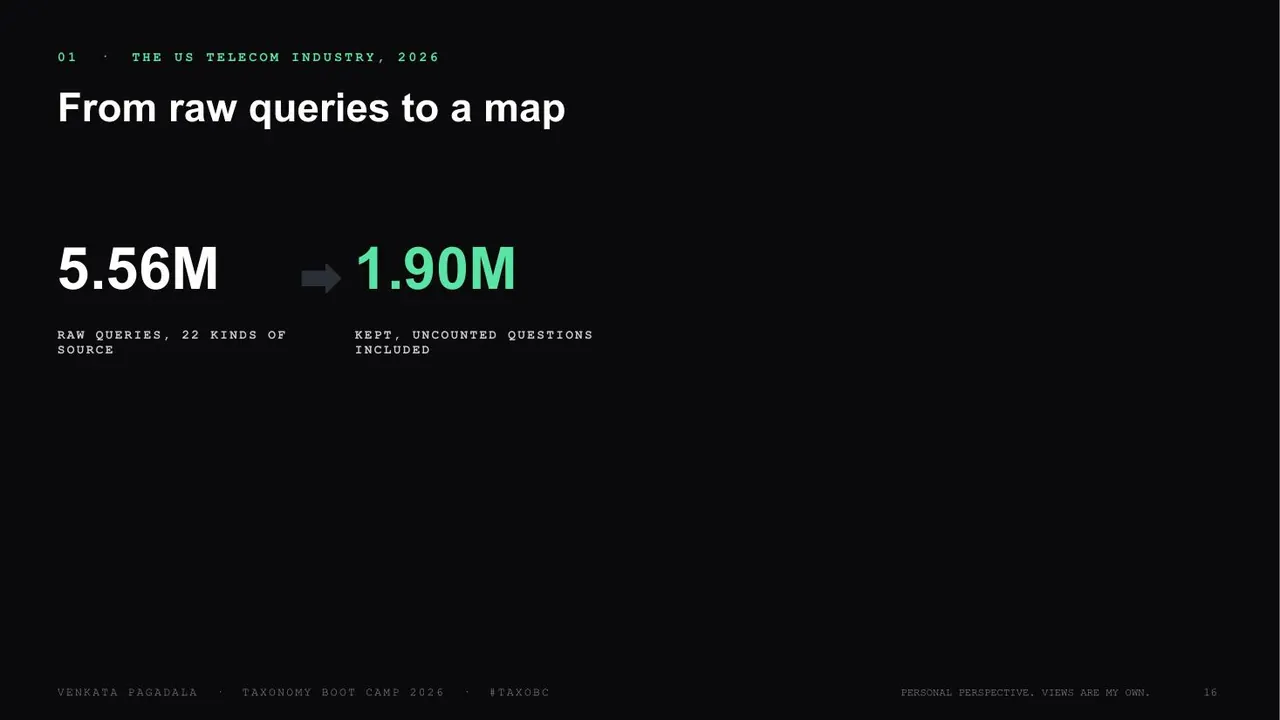
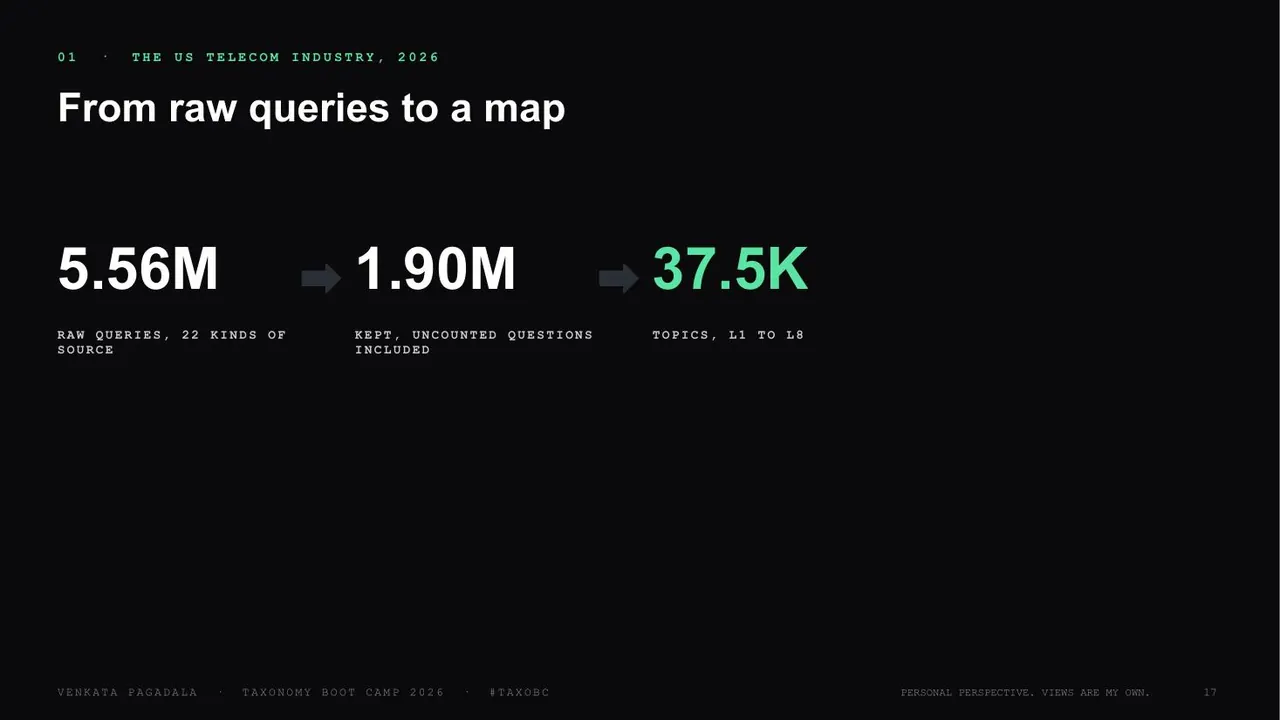
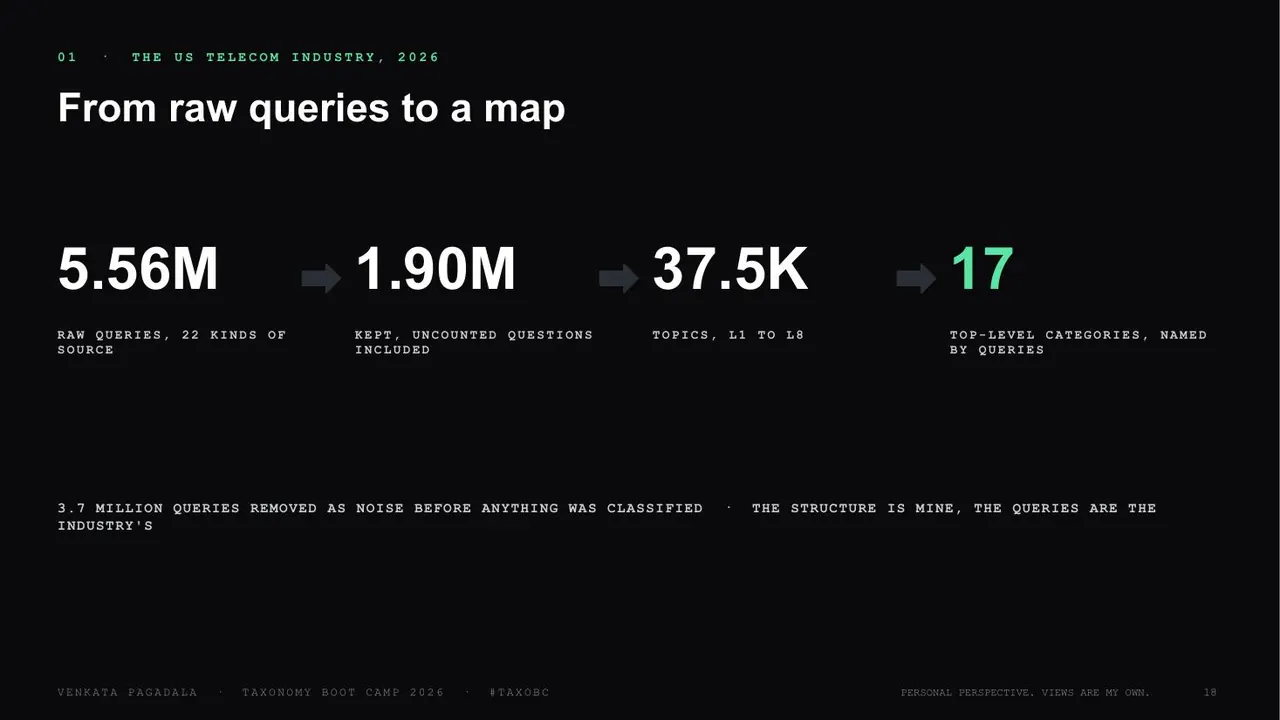
[4:47]So I decided to answer them all with one simple solution. I analyzed the whole industry: 5.56 million queries. Then I kept about 1.9 million, with uncounted questions, grouped them into topics, and found the top-level L1 queries.
[5:10]If you look at this: from 5.56 million, I cleaned up 3.7 million of noise. That is crucial for knowledge management, because accuracy plays a key role: a wrong classification can dilute the whole project. I'm going to explain the steps to avoid as well.
5:36One search, four signals
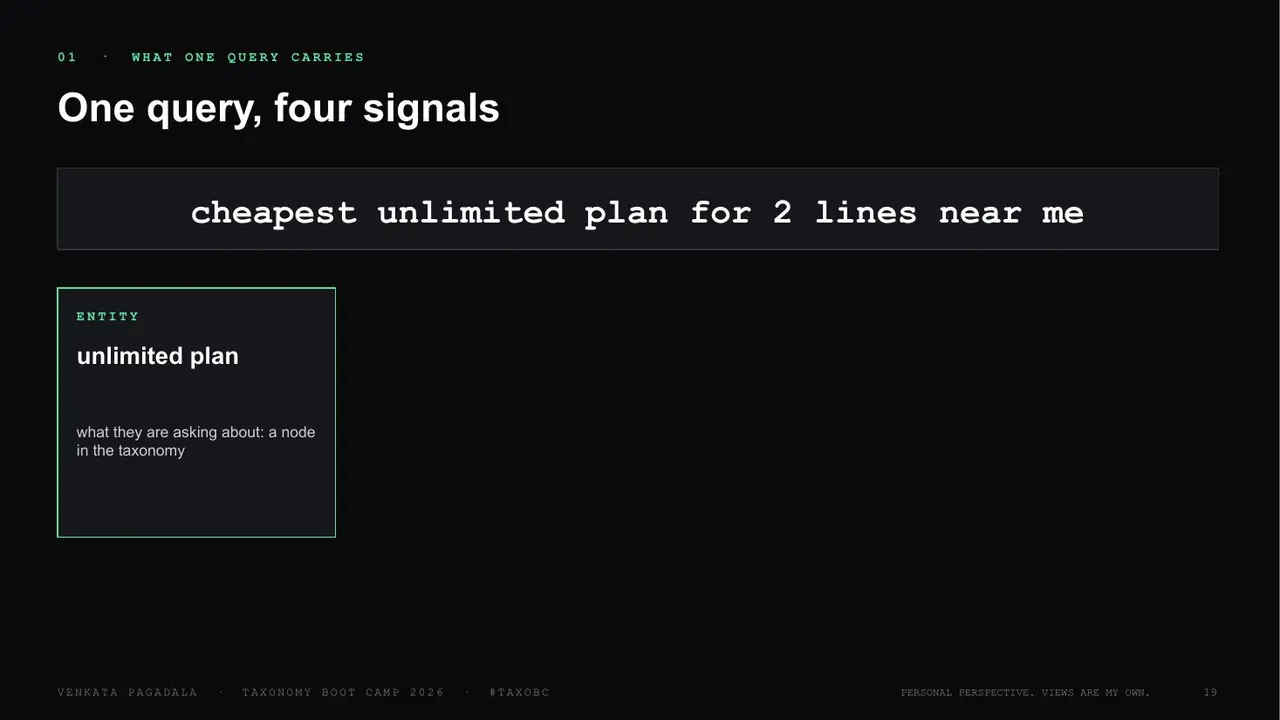
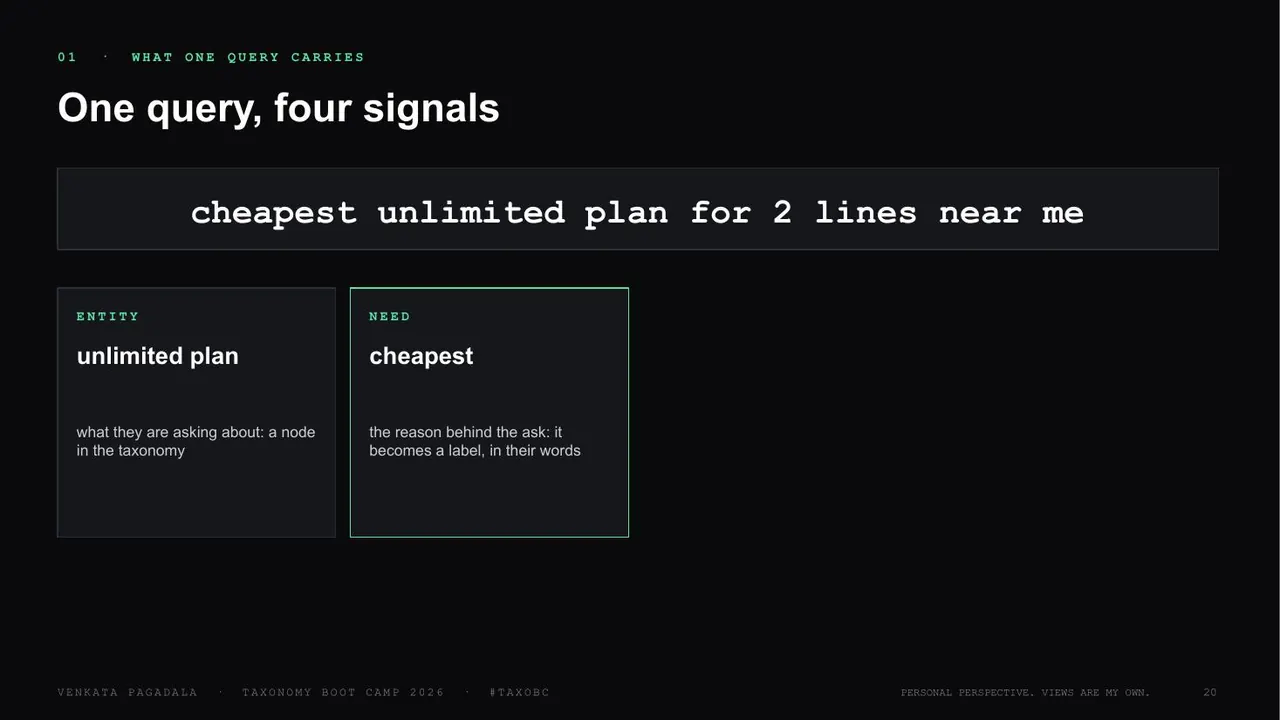
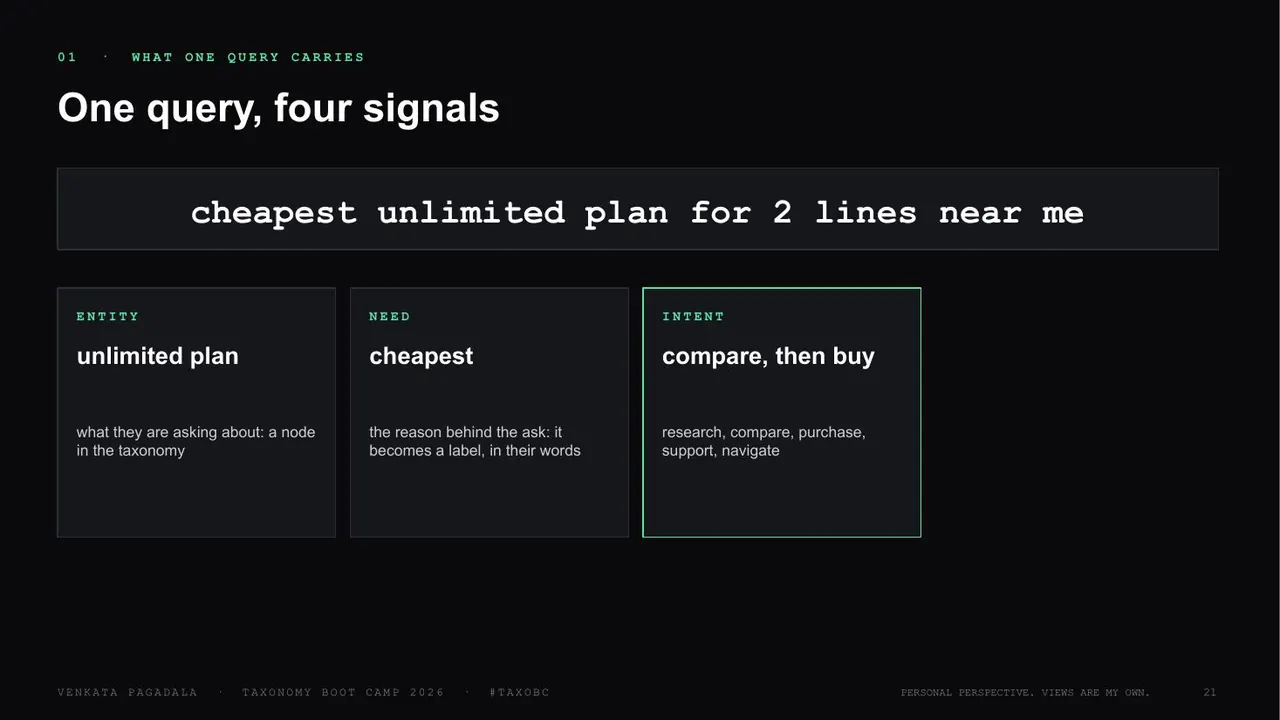
[5:36]Let's take one example: "cheapest unlimited plan for two lines near me". You can see four kinds of signals there. "Unlimited plan" is the entity, "cheapest" is the need, compare is the intent, and the modifier is "near me".
5:53Where the searches come from
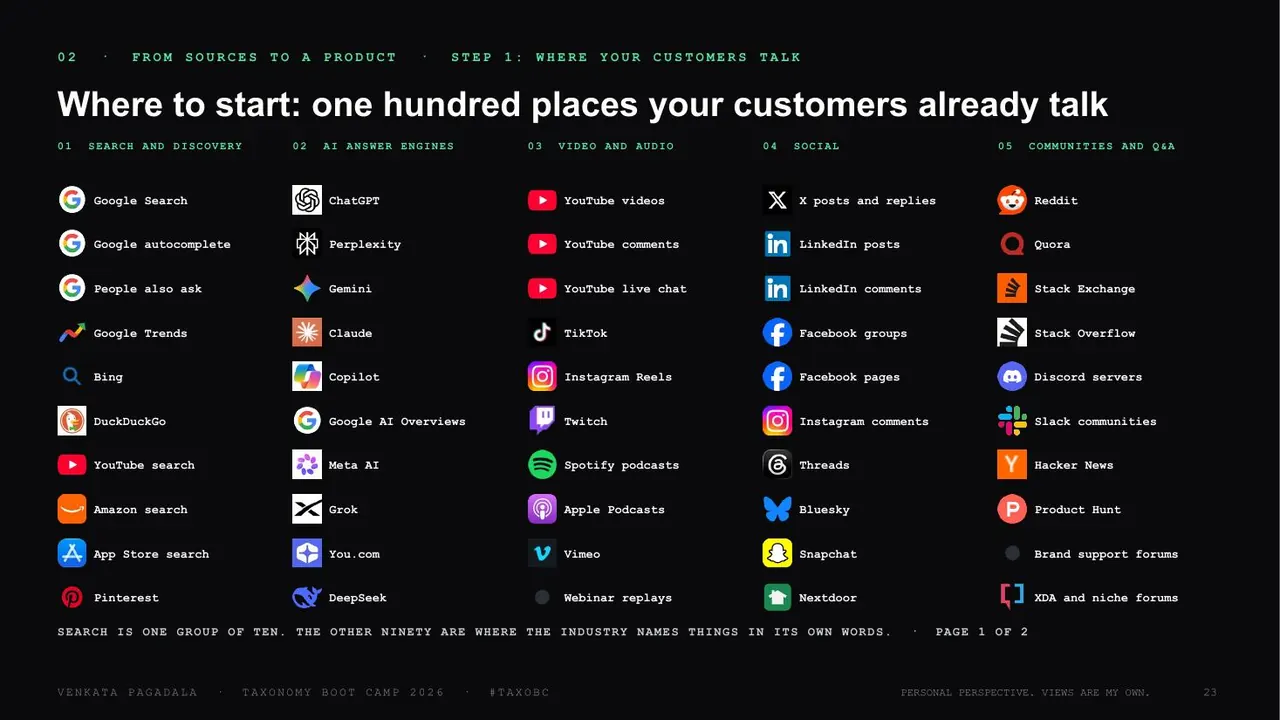
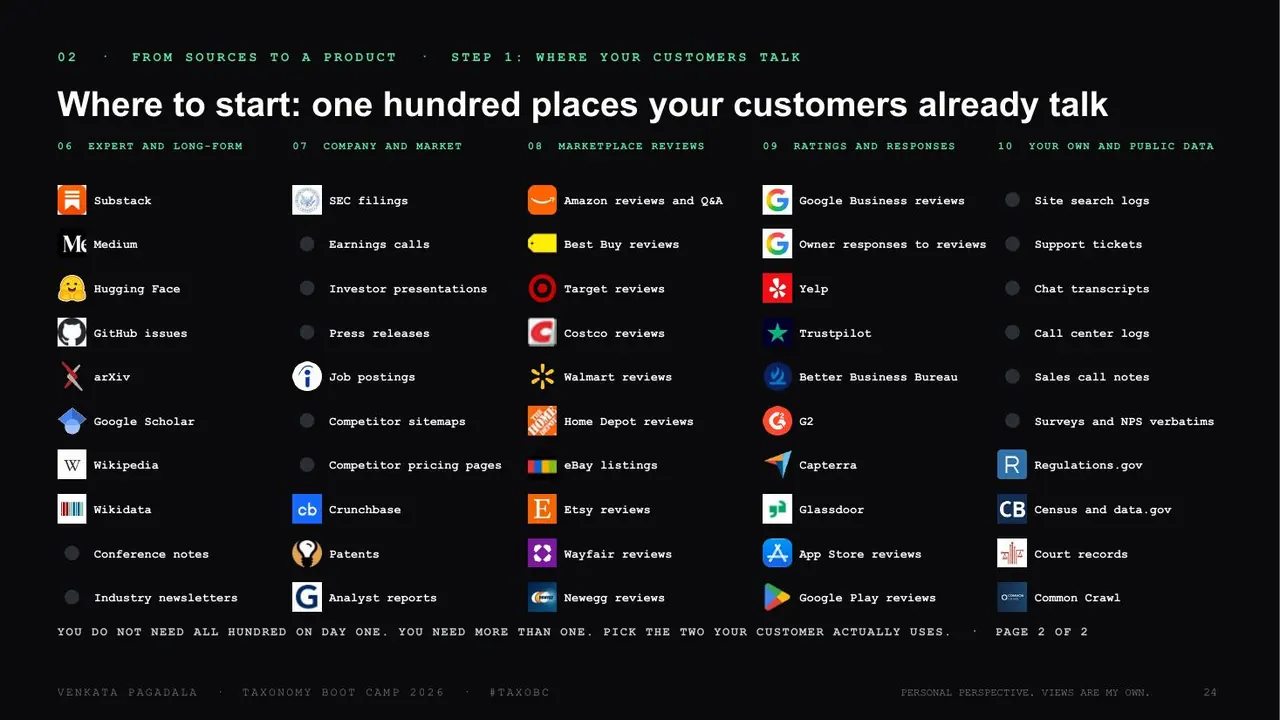
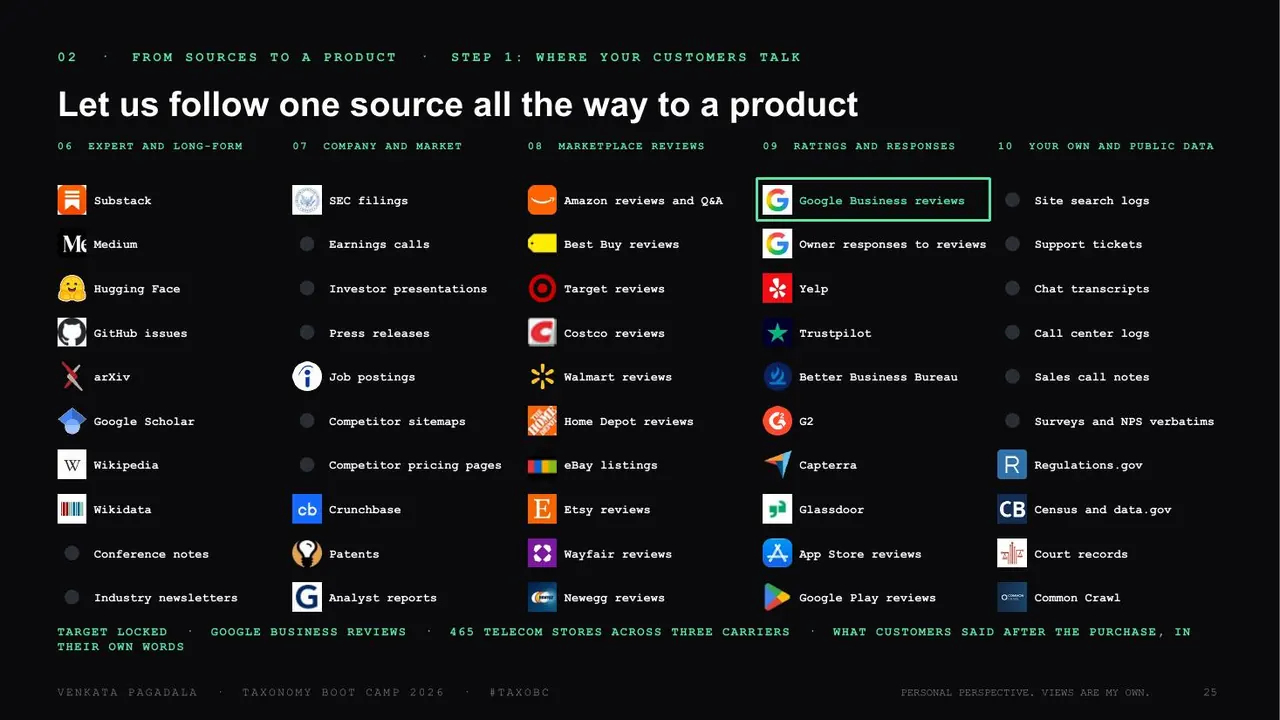
[5:53]So where can I get these queries from? People leave digital footprints all over the place. From Google Search there are a lot of tools, and there are first-party and third-party data sources as well. You can see reviews, ratings, the actual posts and comments. I'm not going to explain each source one by one, but you can see search and discovery, answer engines, video, audio, social and communities. Reddit plays a key role in finding queries and helps with classification, and experts write in long form. You can find all of these query data sets to start with, for a product, a service or a topic.
6:38One complaint becomes a product
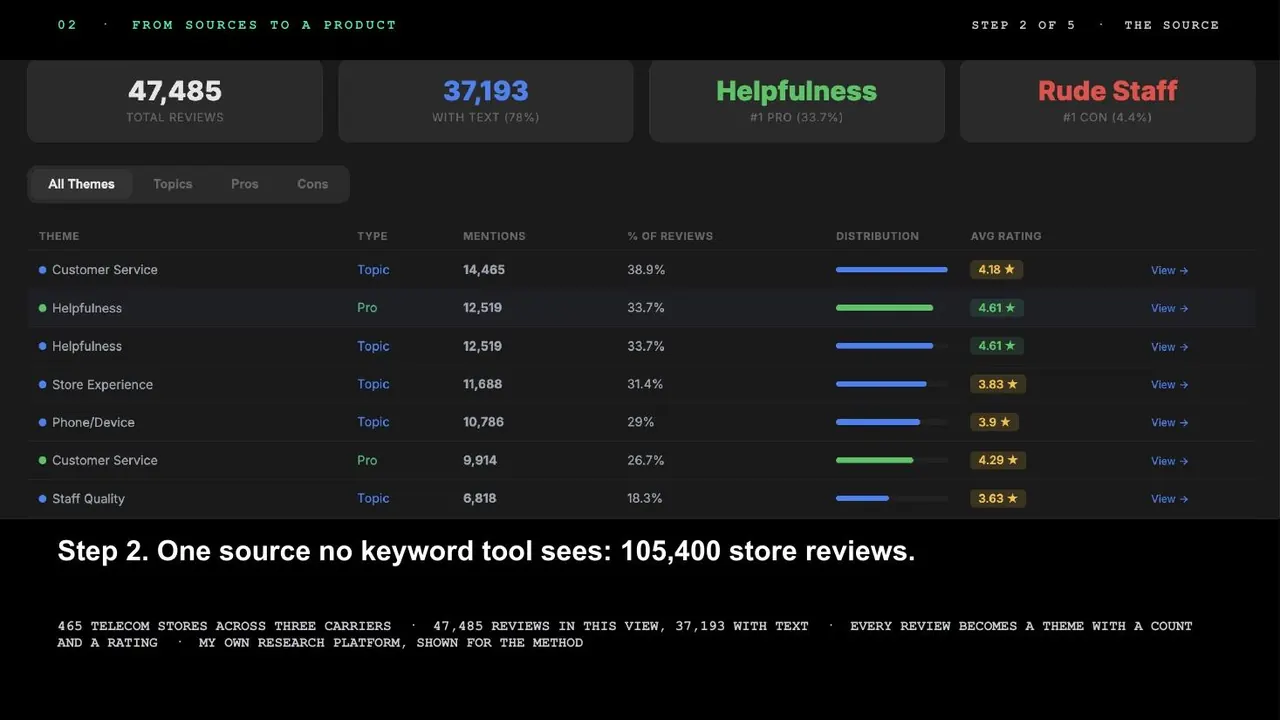
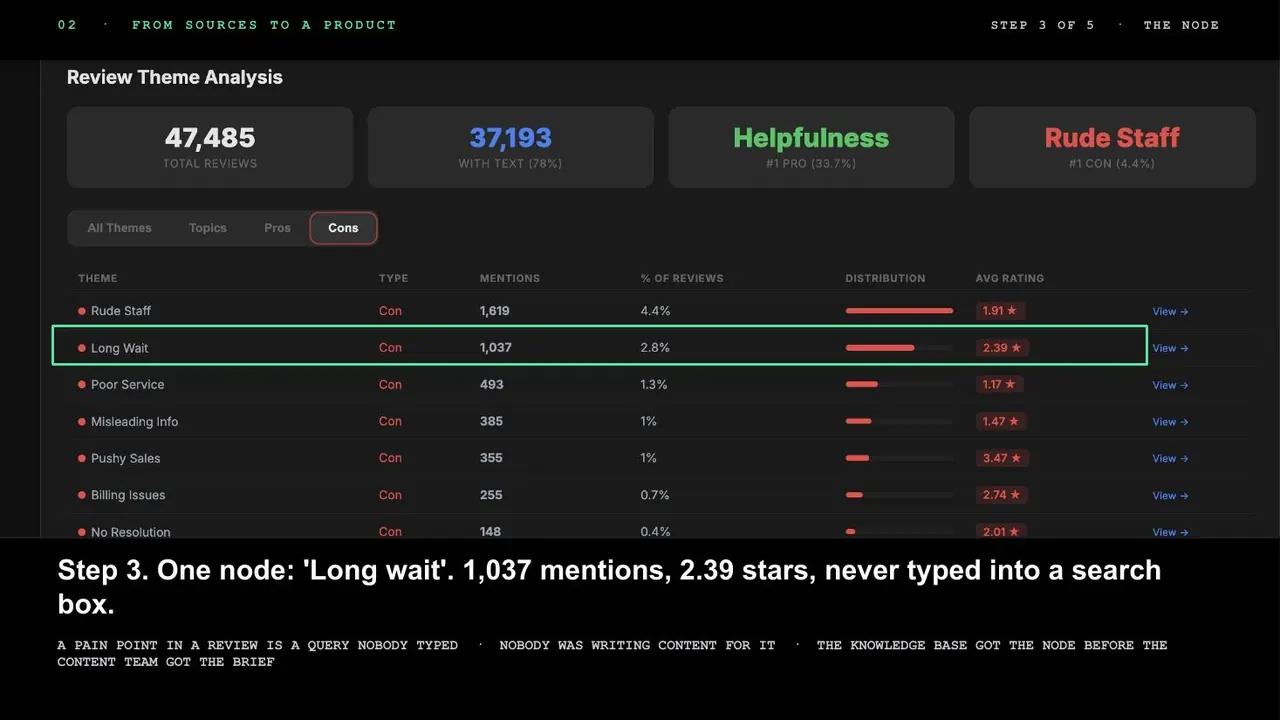
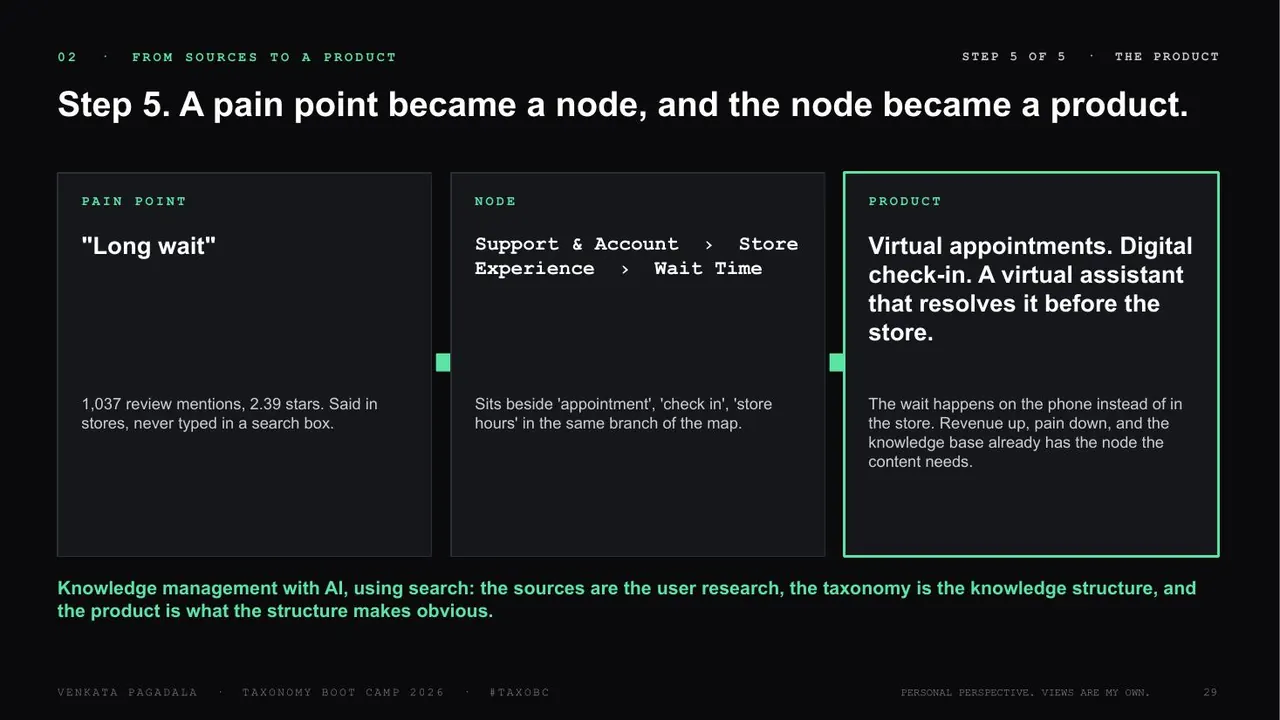
[6:38]I'm going to take Google My Business reviews as an example. I was curious about the common pain points in the telecom industry for local stores: if you go to any local telecom brand, what are the pain points industry-wide, not for one specific brand? I analyzed a hundred thousand reviews, especially in one location, Texas, and found these pain points. One that is mentioned a thousand times, the second most common pain point, is a long wait.
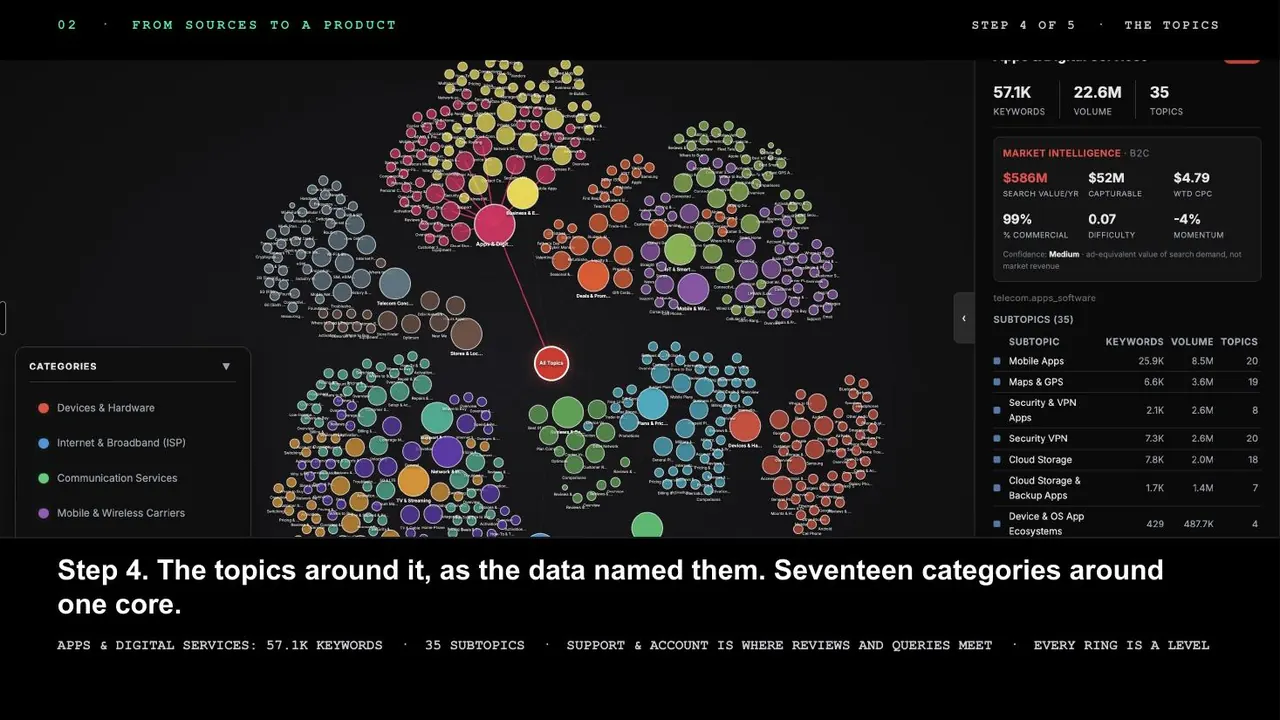
[7:11]So how do we classify this? Before jumping into classification: if I didn't have one view of the relations between the topics, I would have a really hard time connecting the dots. So I put everything together and created a relational graph. 'Long wait' is the node, and from the graph I understood that it comes under Support & Account, then store experience, then wait time. That's how we classify it.
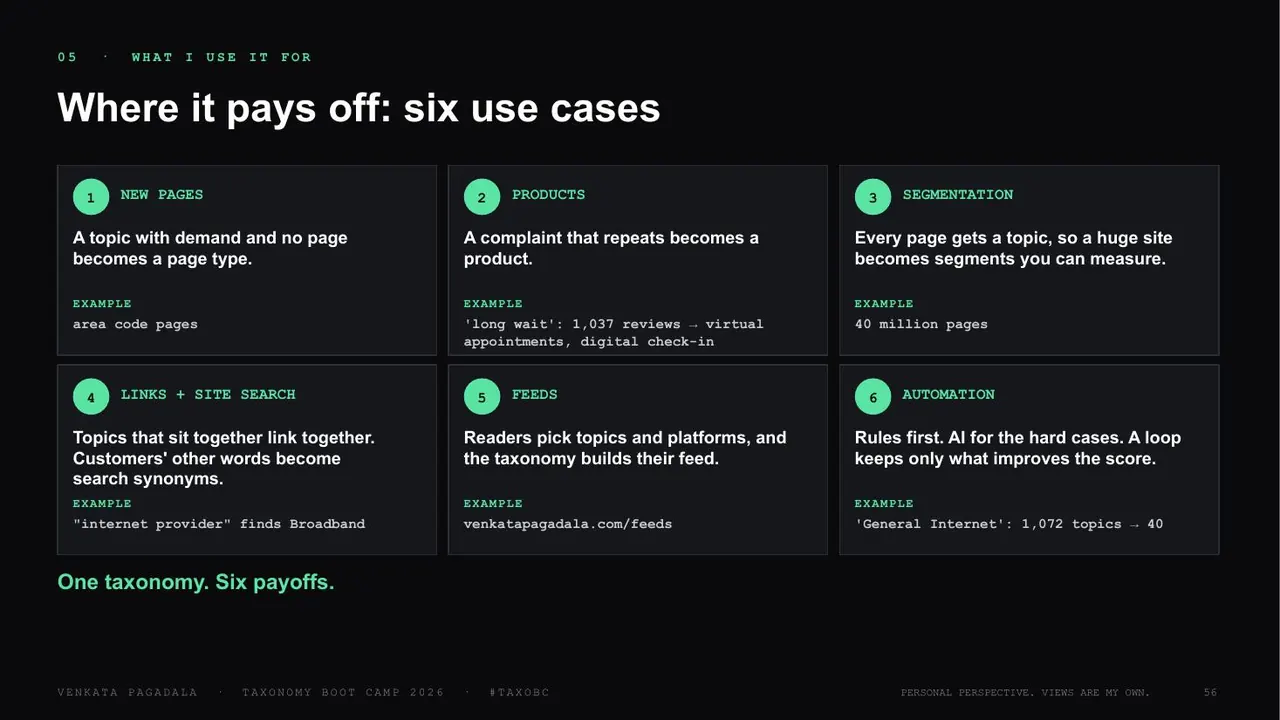
[7:48]So the source is the reviews, the graphical relation is the node, and the product can be defined by each company. Examples would be virtual appointments, digital check-ins, or virtual assistants: an agent that helps resolve things faster, before a human talks to the customer, to reduce the wait time. That's the method: find the source, classify it, and build a product. That's how the return on investment happens.
[8:17]But if you don't classify the data in the right place, every time new data comes in it is stored somewhere different, and cleaning and reorganizing the whole thing takes as much time again.
8:31Four levels, and when to go deeper
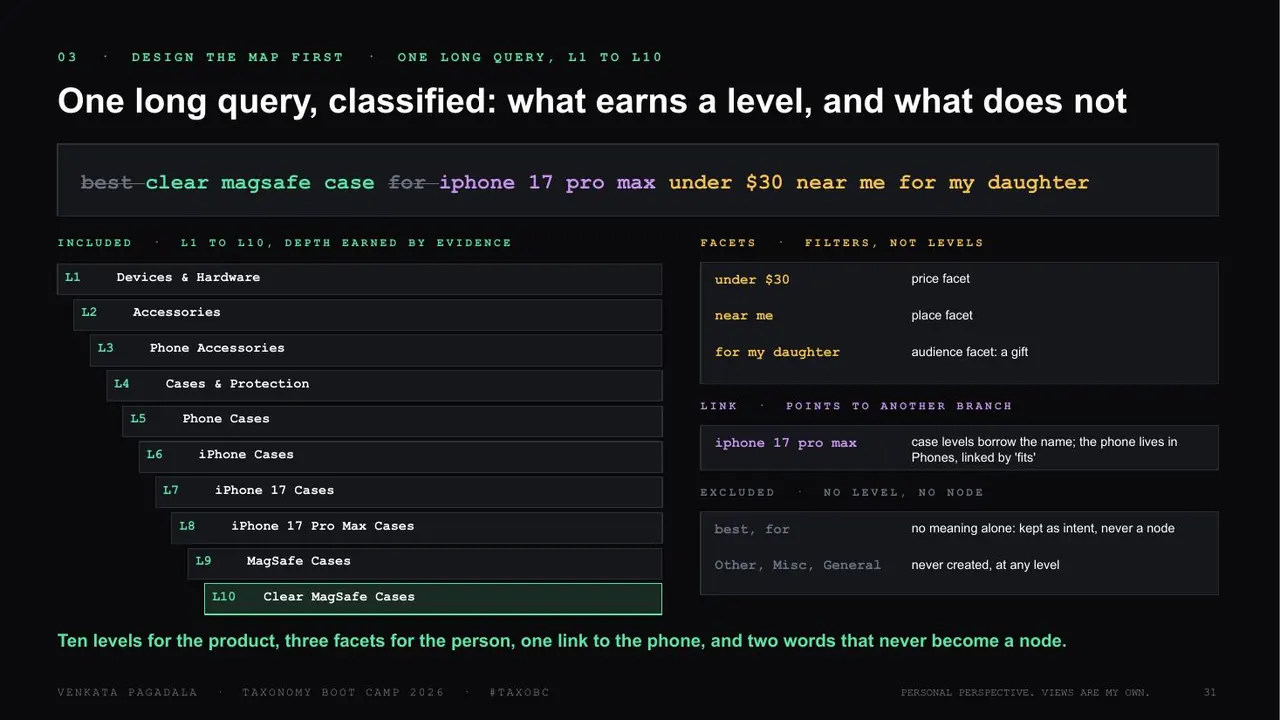
[8:31]Four levels of structure: category, subcategory, topic bucket, and keyword node. Are the four levels fixed? No, it depends on the queries. Here is one query, classified: what earns a level and what does not.
[8:44]The query is "best clear MagSafe case for iPhone 17 Pro Max under $30 near me for my daughter". This is a common way people search in AI or on Google. So I have to start from the core product. The foundation level would be device hardware. Under that come accessories, and the accessories clearly mention the iPhone 17 Pro Max. Then cases and protection, then phone cases, and then [unclear] iPhone cases.
[9:18]These can be structured in many ways, but keep in mind that the levels have to be right. You cannot have accessories above device and hardware, or cases and protection above the phone [unclear], because the data should flow from step one to step two, not from step two to step one. The path to the end goal should be a structured flow.
9:48From a tree to a graph, and the rules
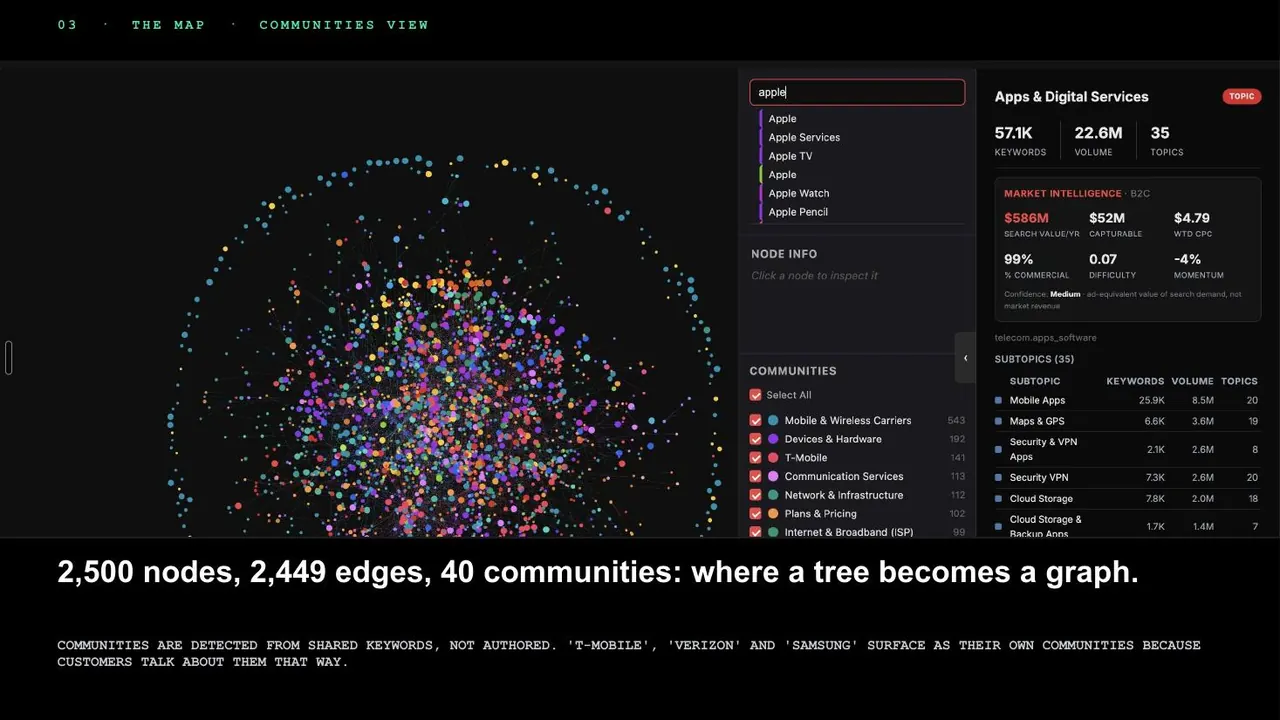
[9:48]So this is how it becomes a tree, and then, from a tree, a graph: once you collect all the data and find the neighbors, this is what it looks like.
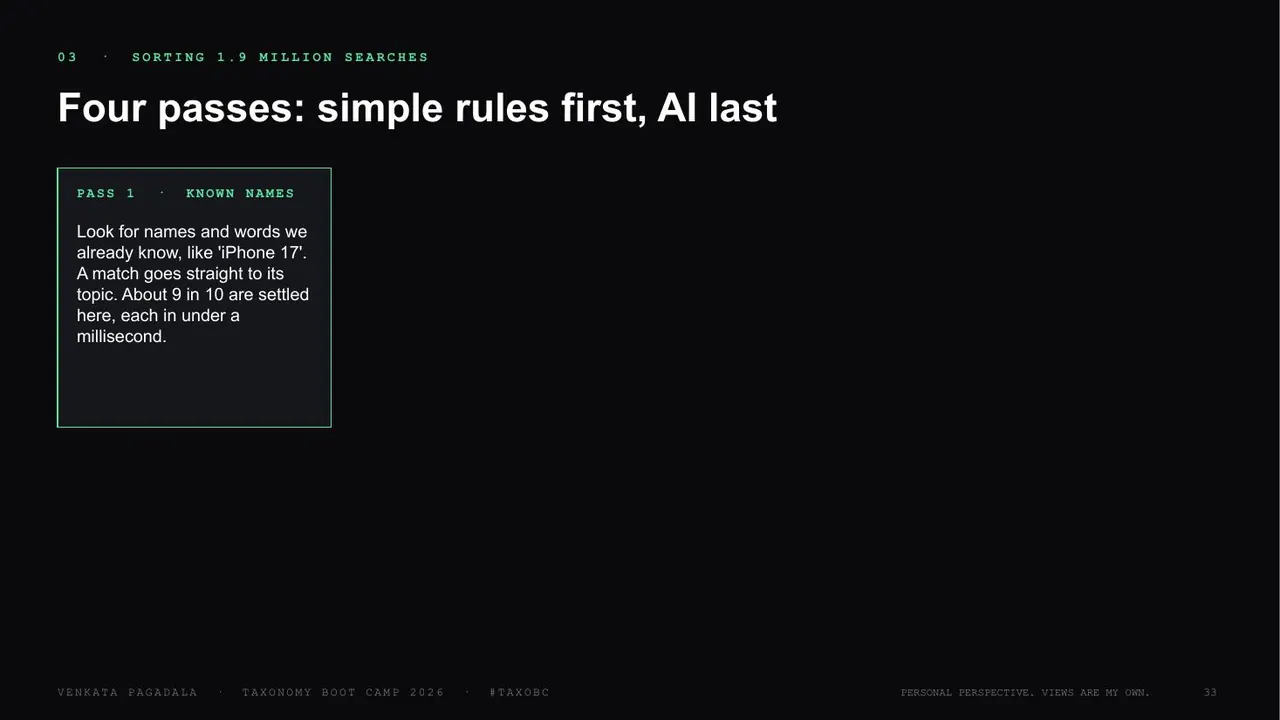
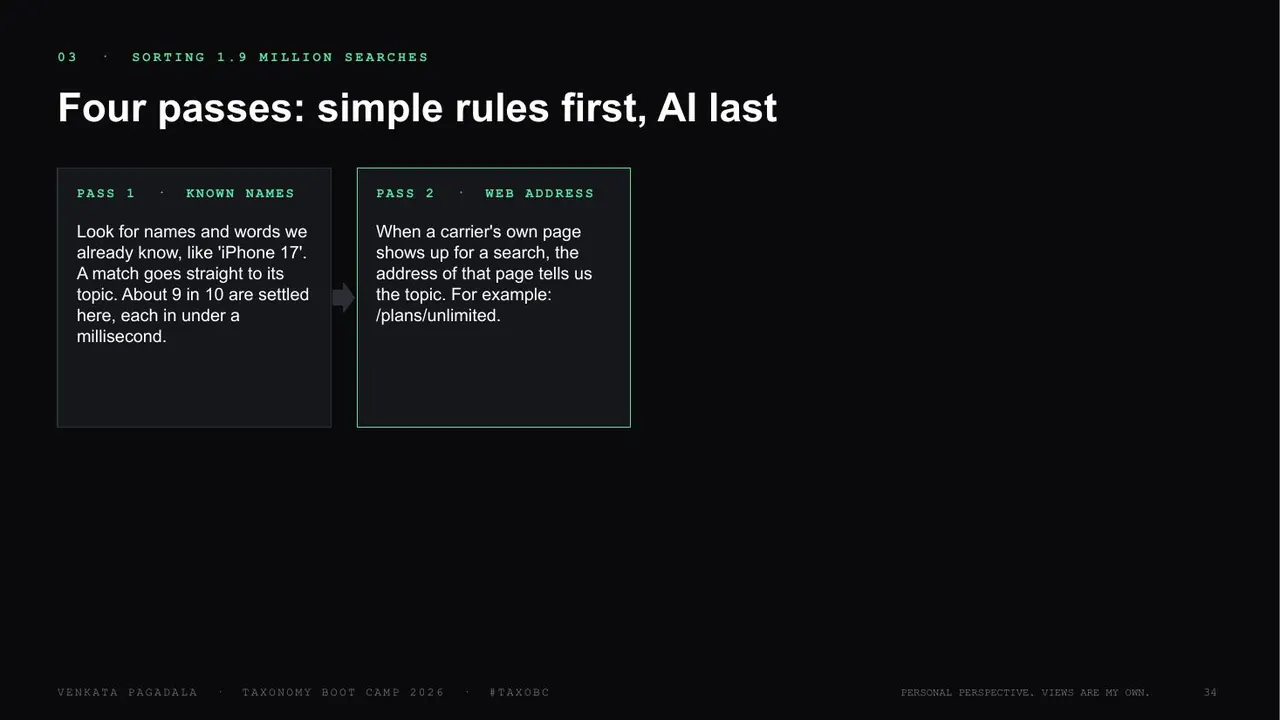
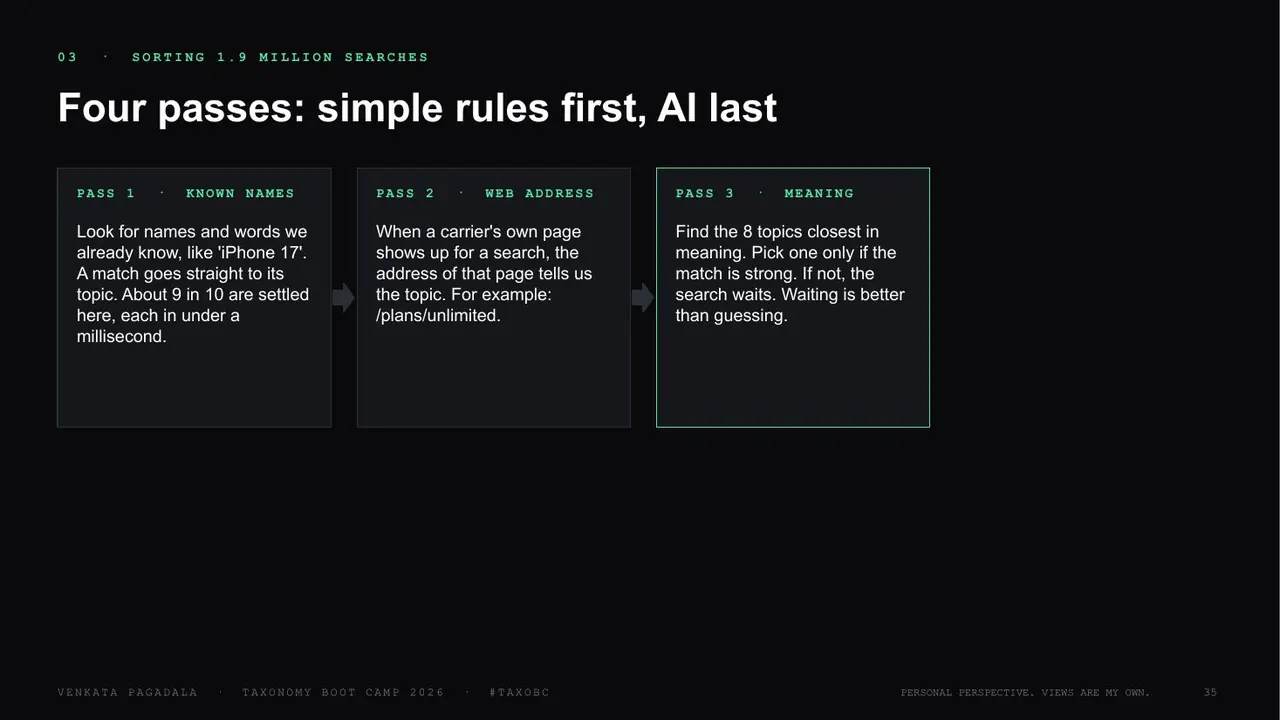
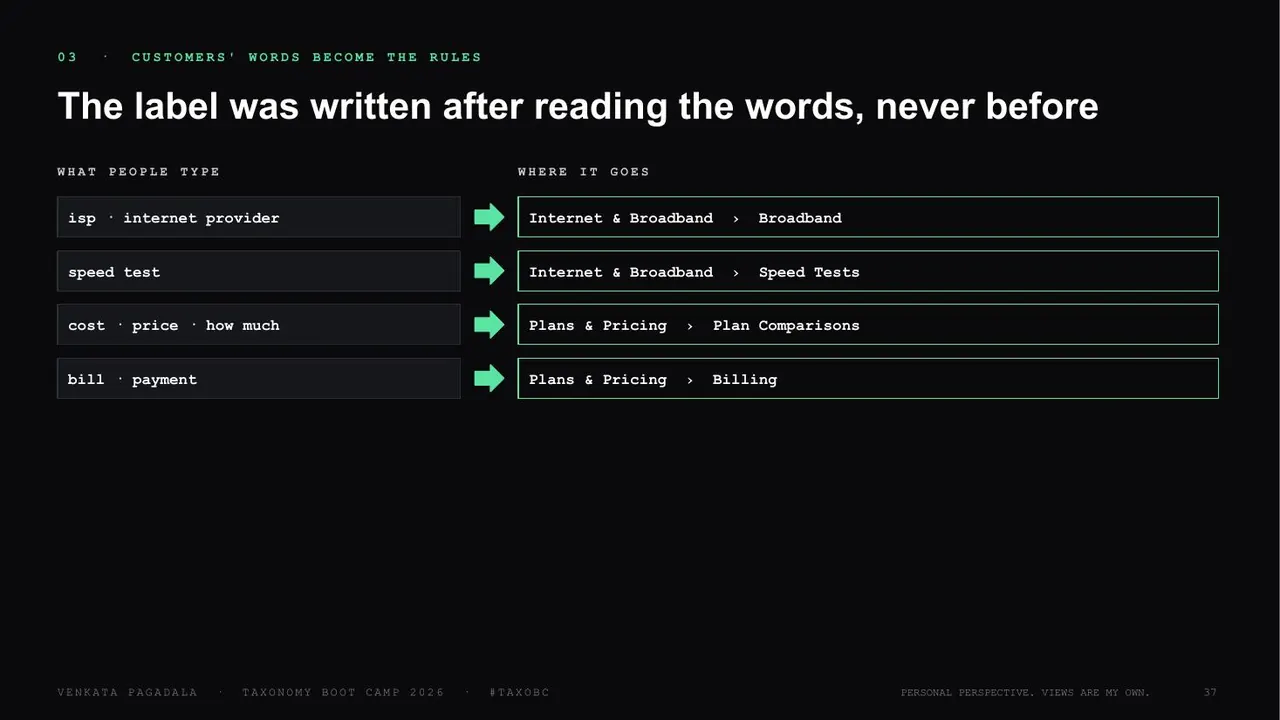
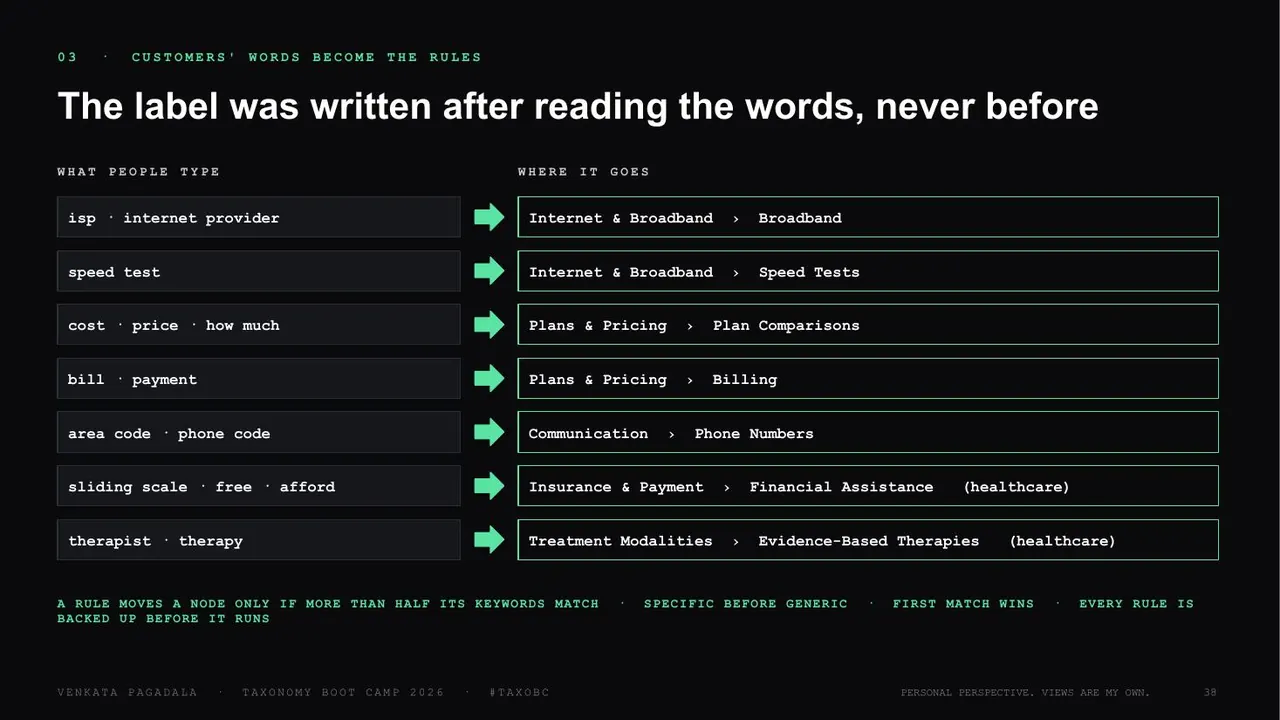
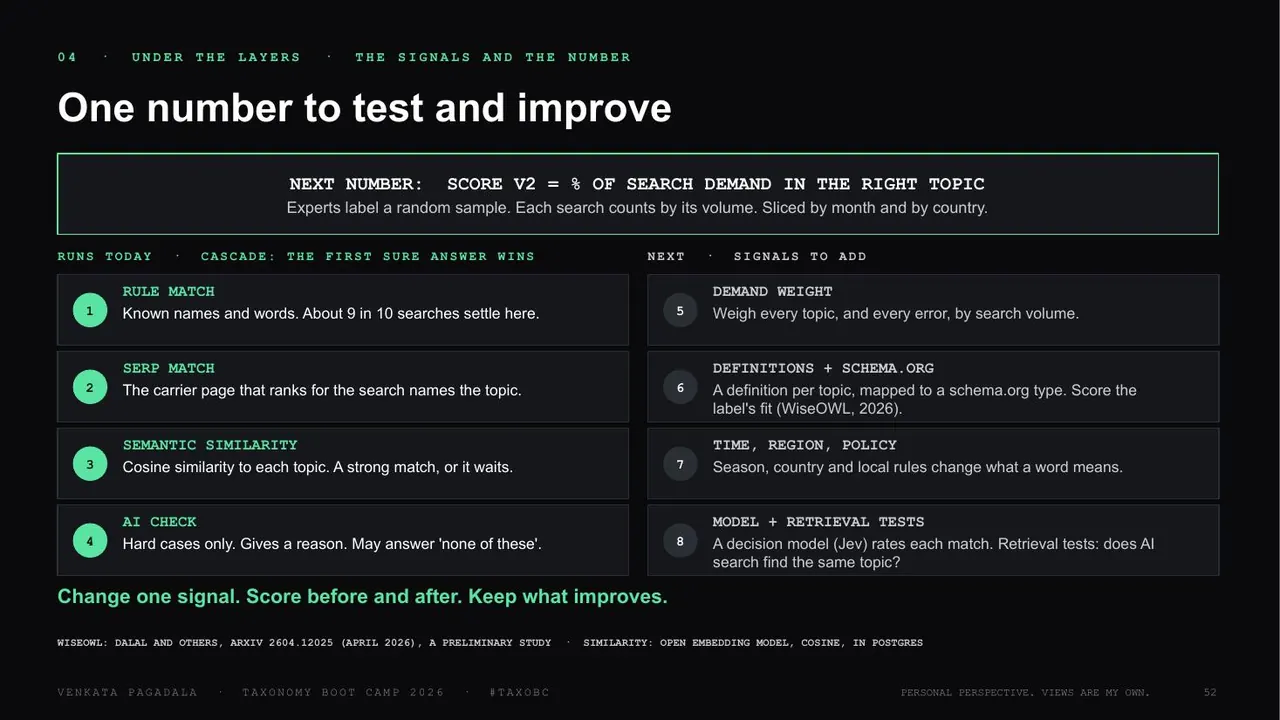
[10:02]These are the four simple rules: known names, web address, meaning, and AI checks. The label was written after reading the words, never before. For example, "speed test" is what people type. Then you need to understand what a speed test belongs to: the primary category would be Internet & Broadband. You can go further, into upload rate and download rate, as specific as you like. I'm just explaining the foundation level.
10:36What a rules-only first pass got wrong
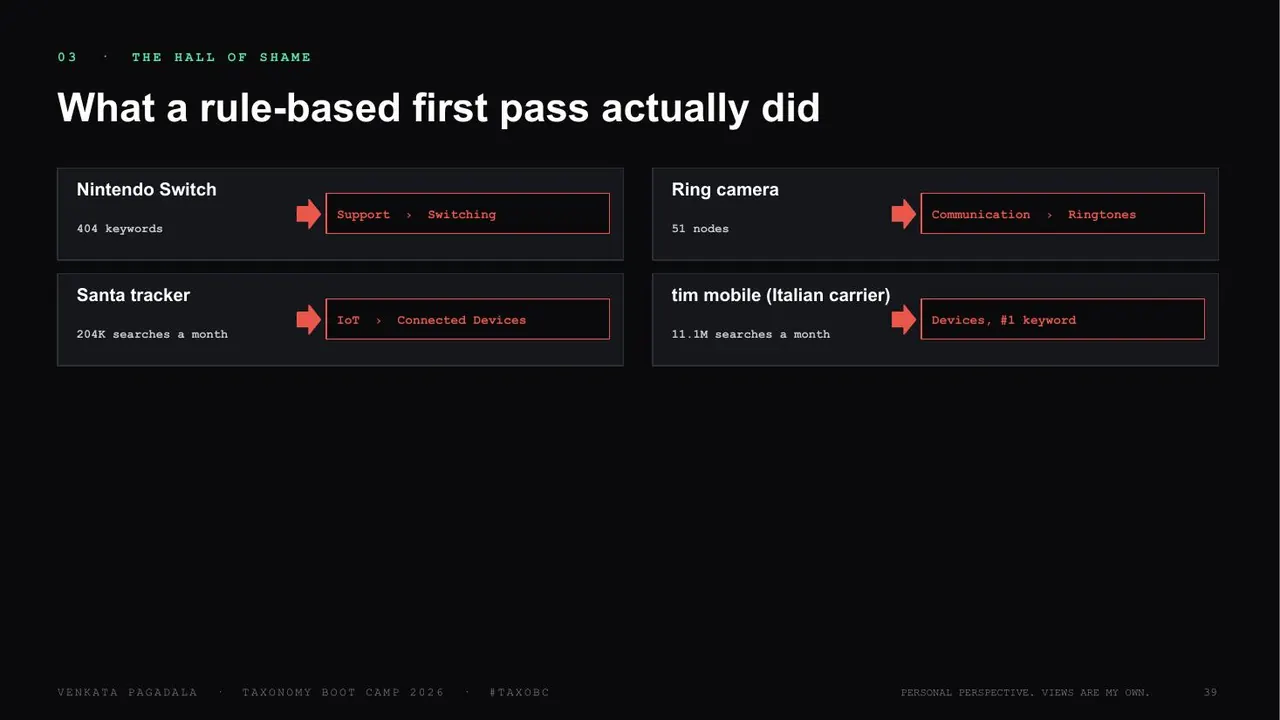
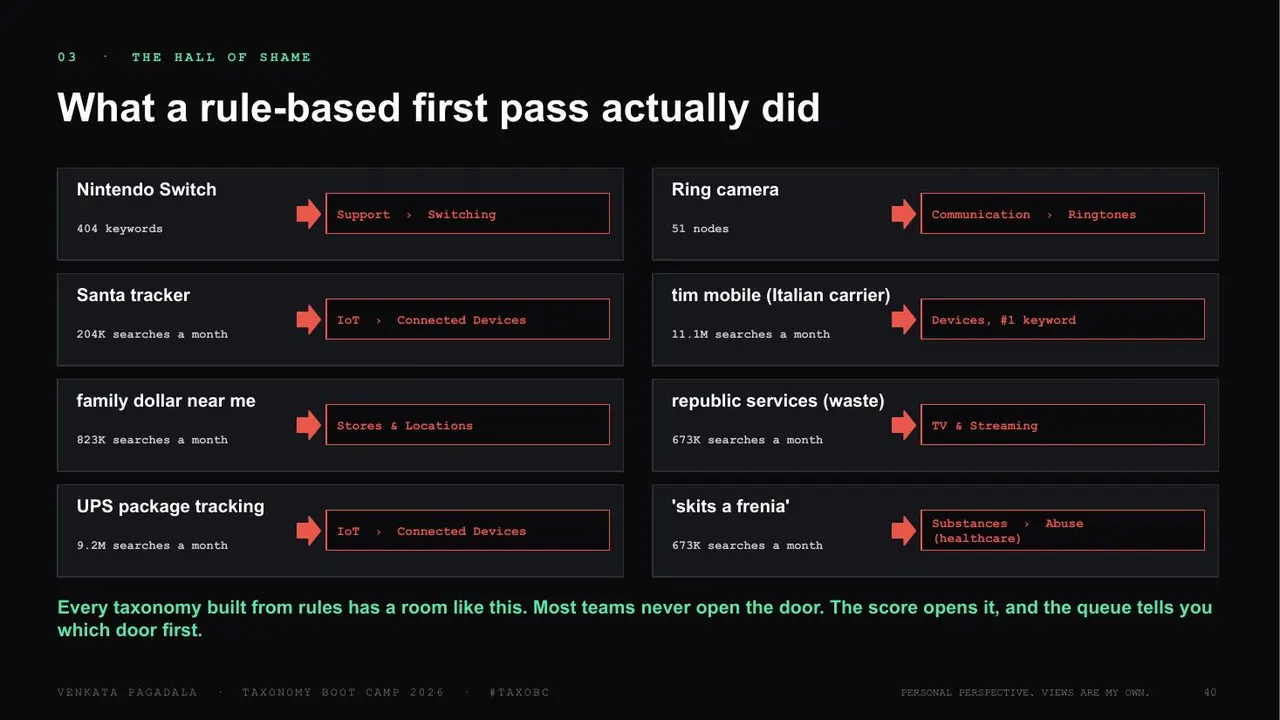
[10:36]Here are a few examples of what a rules-based first pass actually did. We have rules, and in some cases, like "Nintendo Switch", which has nothing to do with the telecom industry, the word "switch" gets it classified into switching. The same with Ring cameras and other things. Even "Family Dollar near me" can be classified into stores and locations, but that is not a telecom classification.
11:03One score
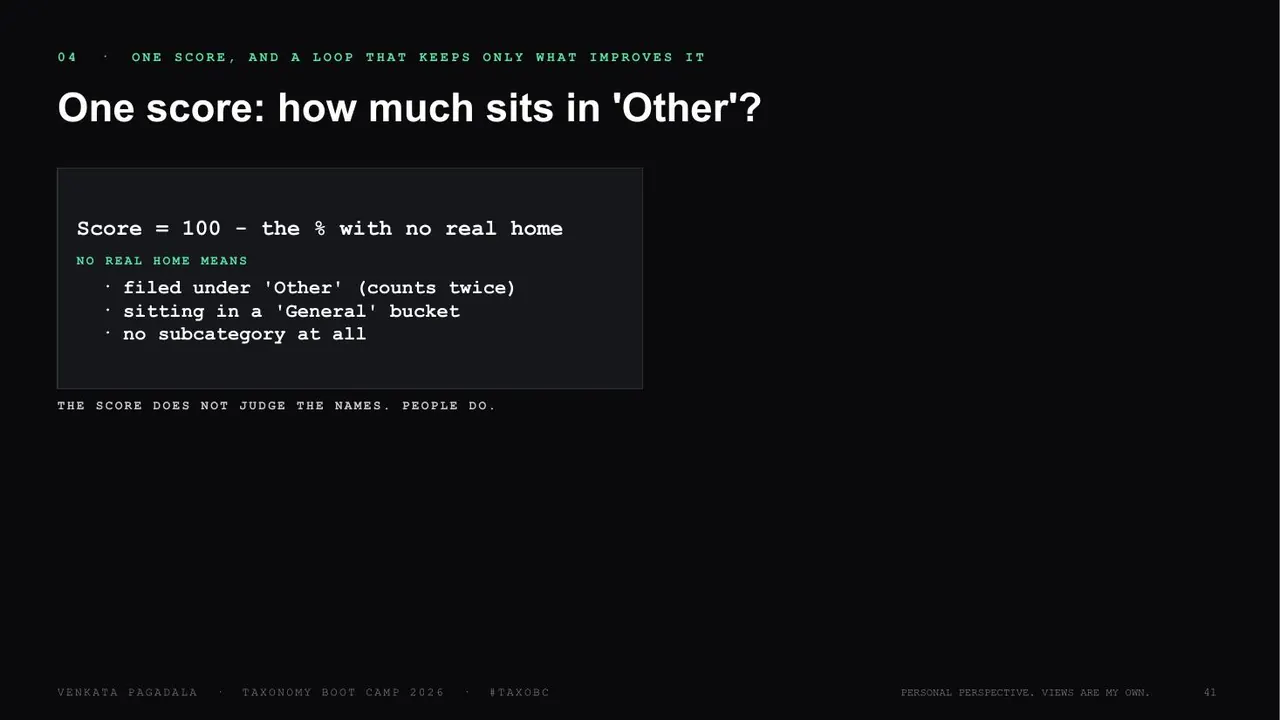
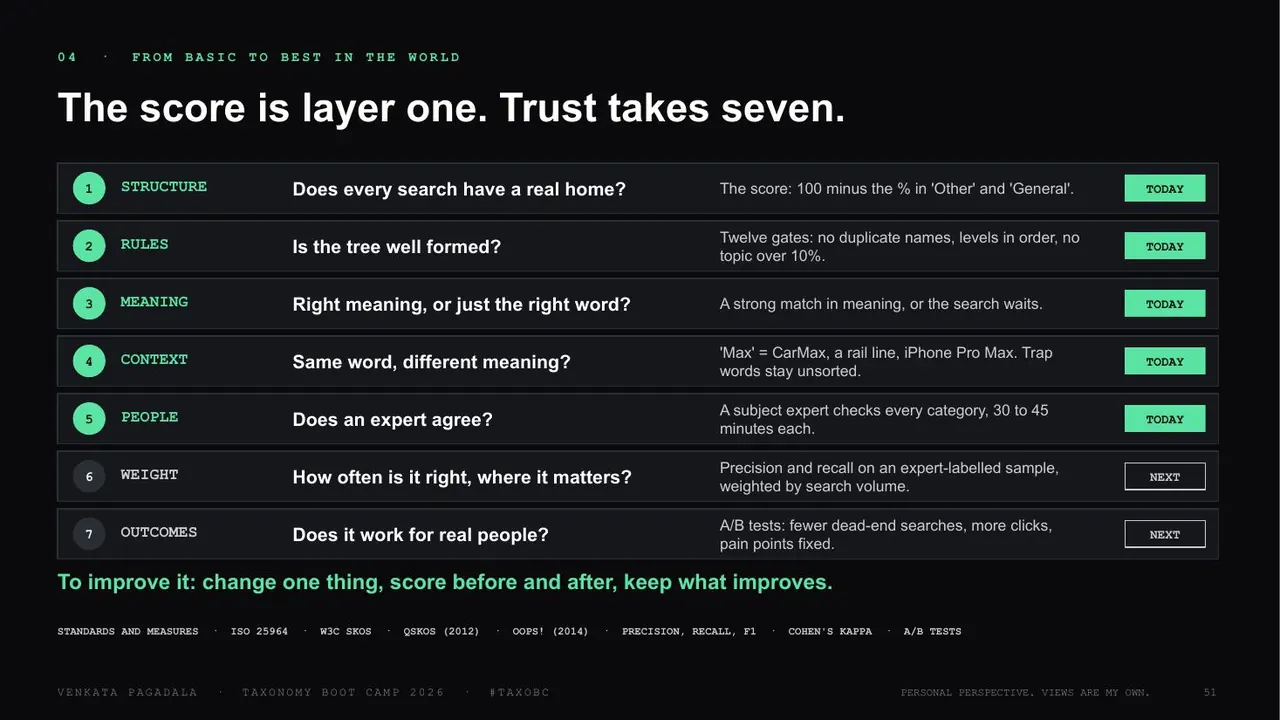
[11:03]So how do you score it, and how do you filter it out? The score is 100 minus the percentage with no real home. We need to find and filter, and use a loop to clean it up. That's how you get the treated topics: the more noise you clear up, and the more generalized buckets you clear up, the better it is.
[11:31]Again, it's going to be really hard to reach 100. Realistically, have a decent number and improve it every time; every percentage point the loop gains is the goal. I don't expect it to be 100%.
11:43Mistakes and gates
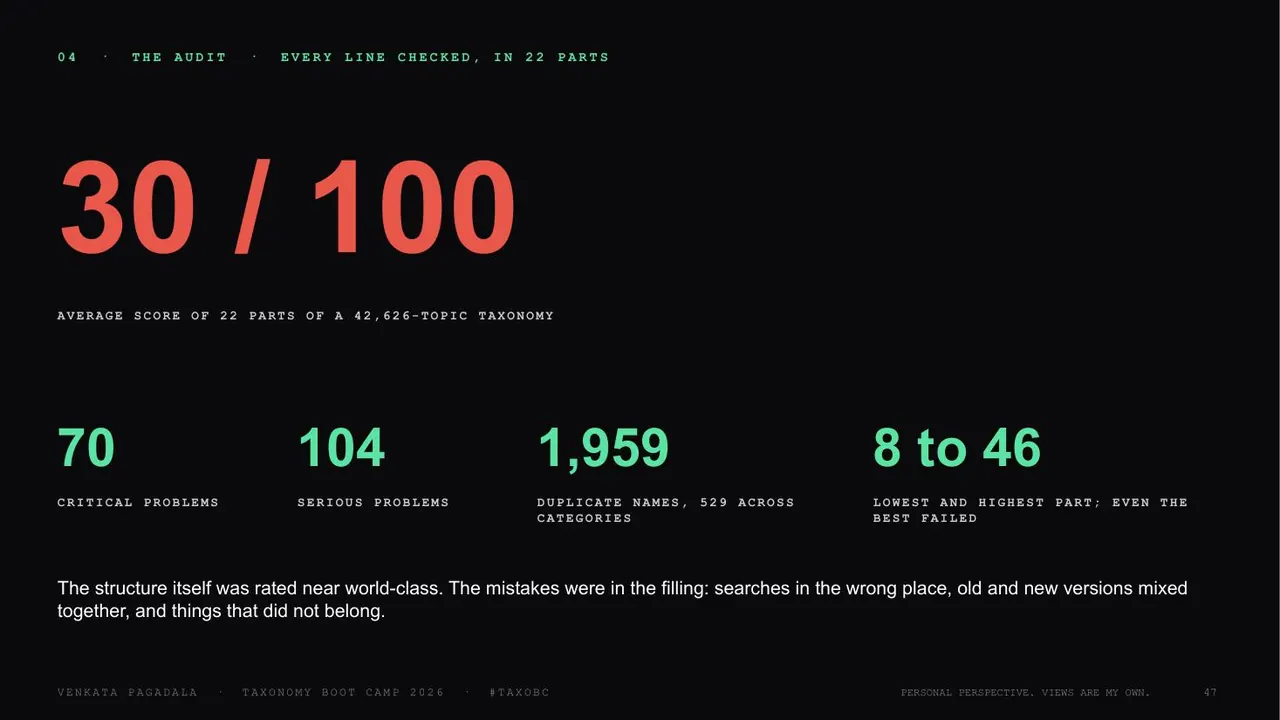
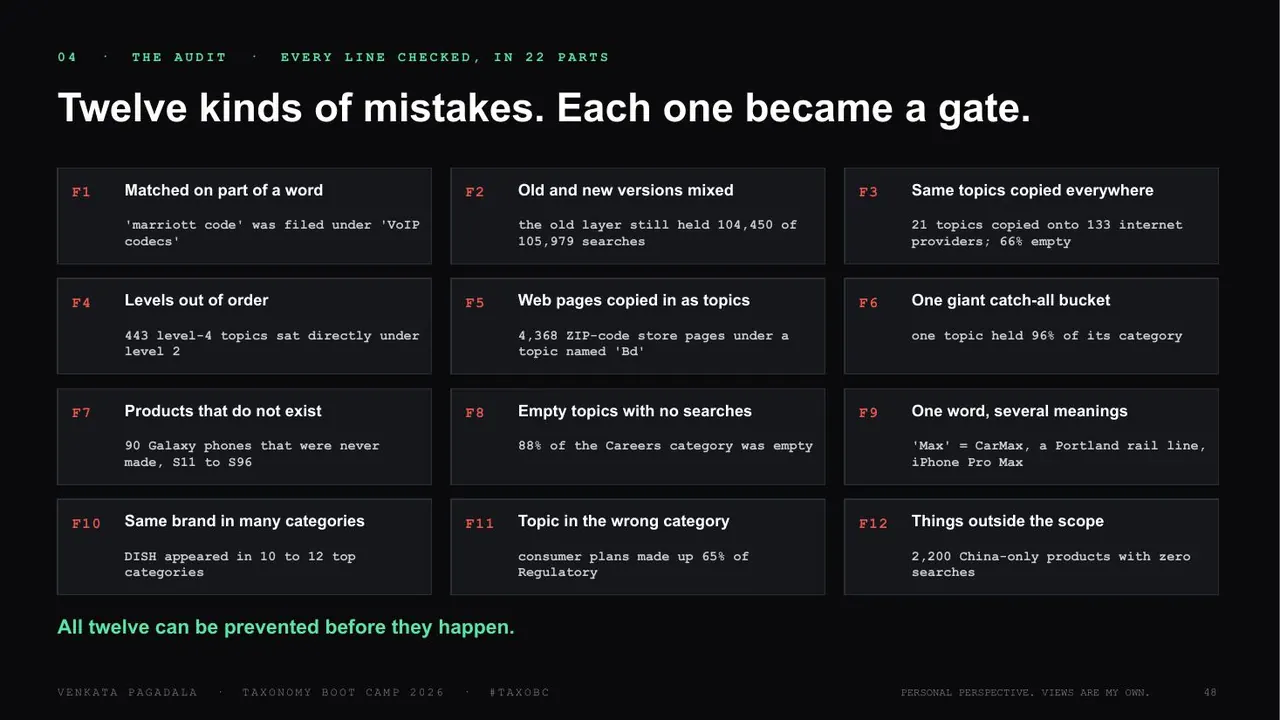
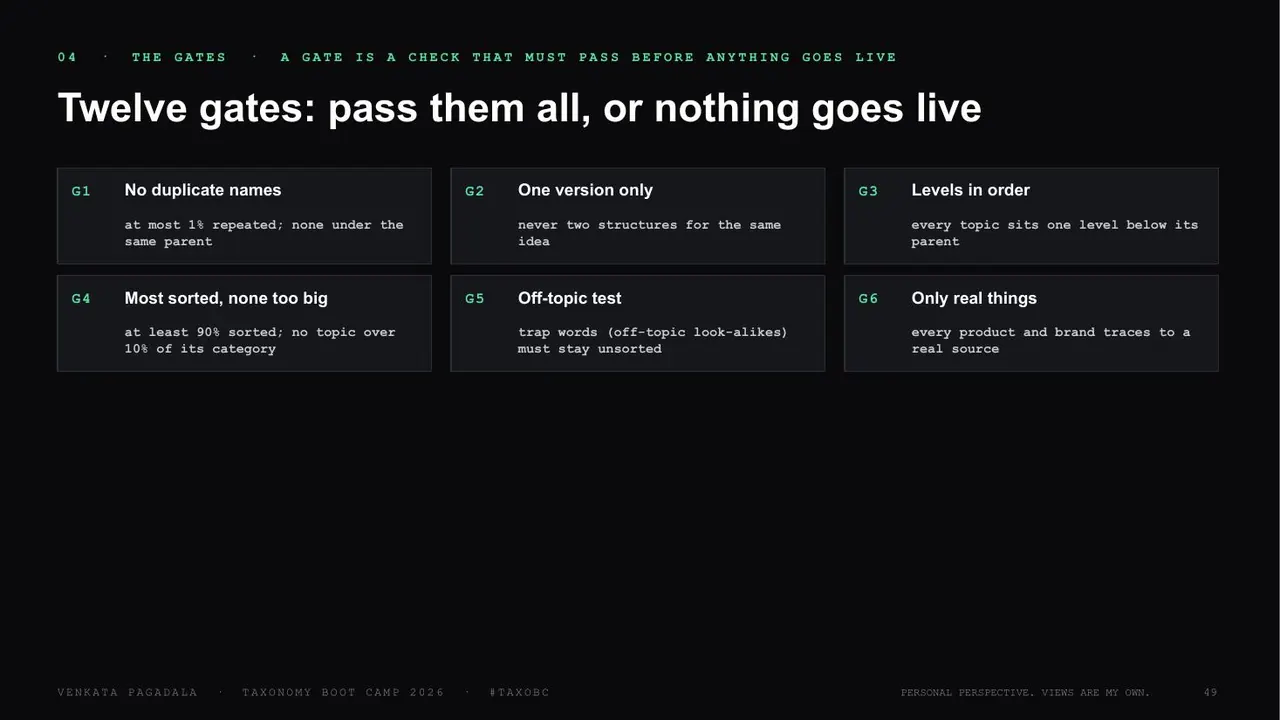
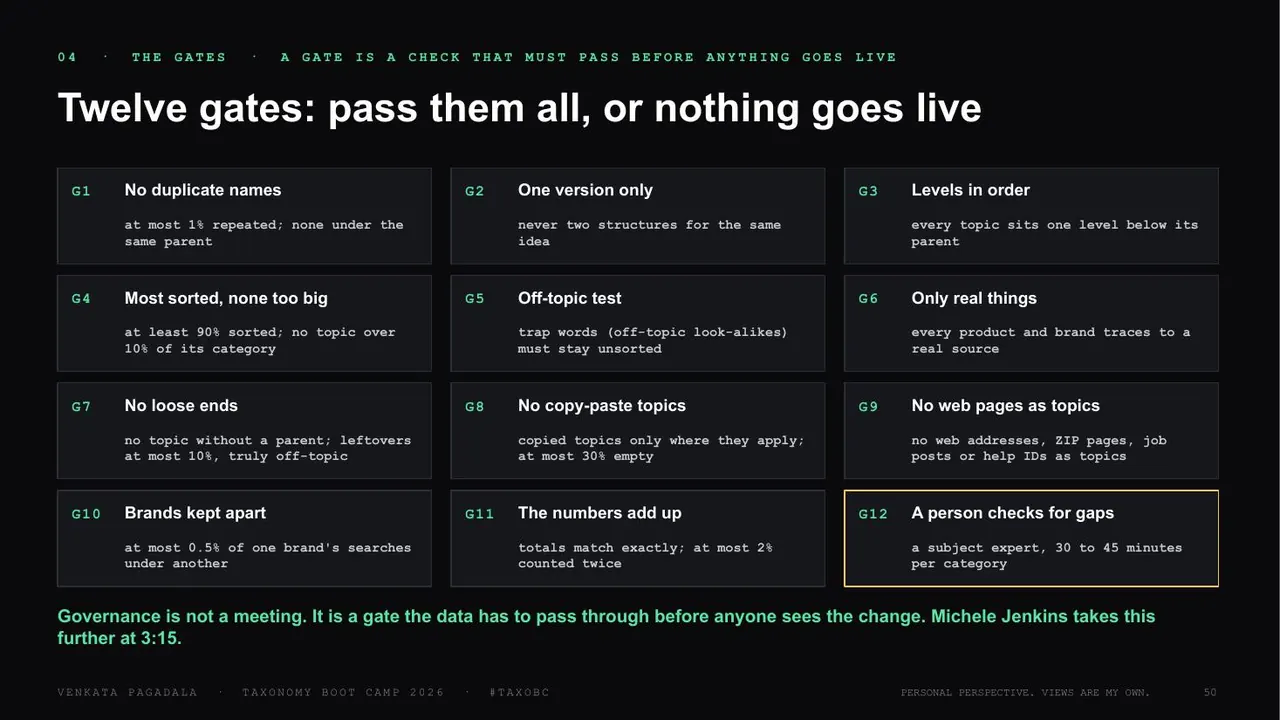
[11:43]These are the stats of the process and the details, and twelve kinds of mistakes, each one with a gate: matched one part of a word, and so on. These are some basic steps to follow: how to keep the levels in order, how to make sure there are no duplicates, and how to avoid gigantic buckets, one word with several meanings, and empty topics. These are some of the things to avoid.
[12:21]And these are some of the basic rules to follow: no duplicate names, one version only, levels in order. Levels in order plays a key role.
12:29Other industries and the checklist
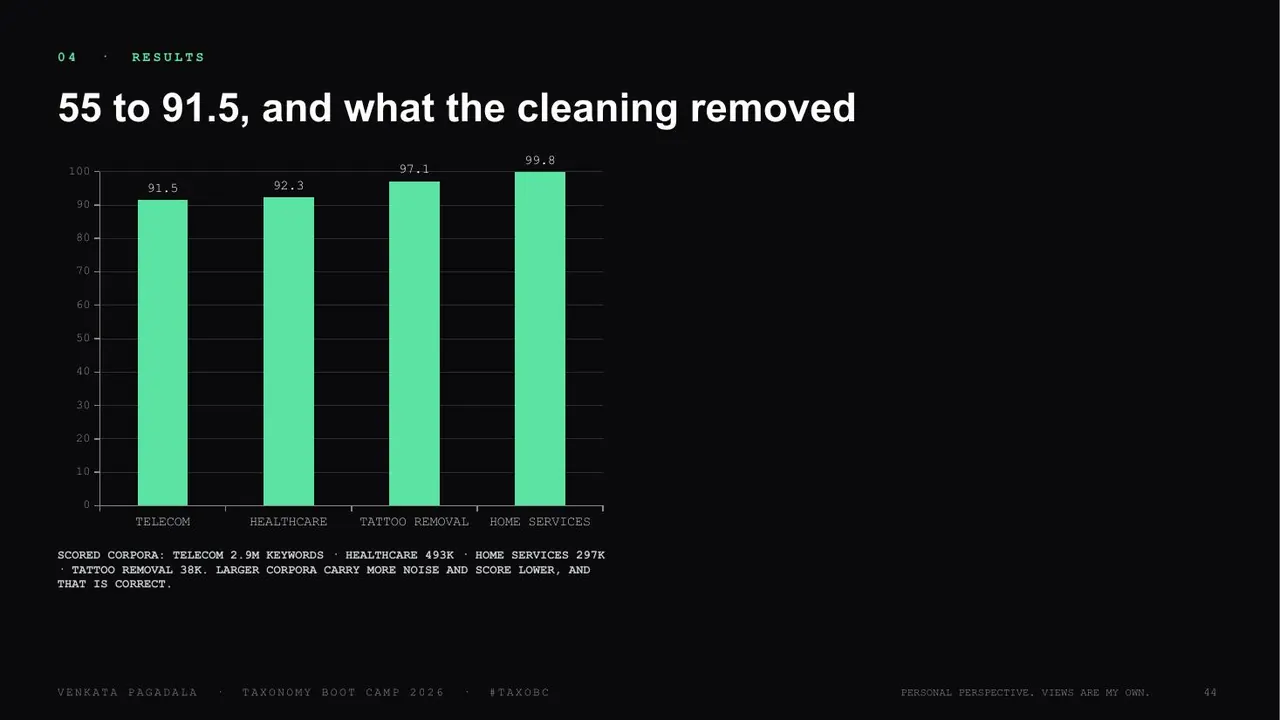
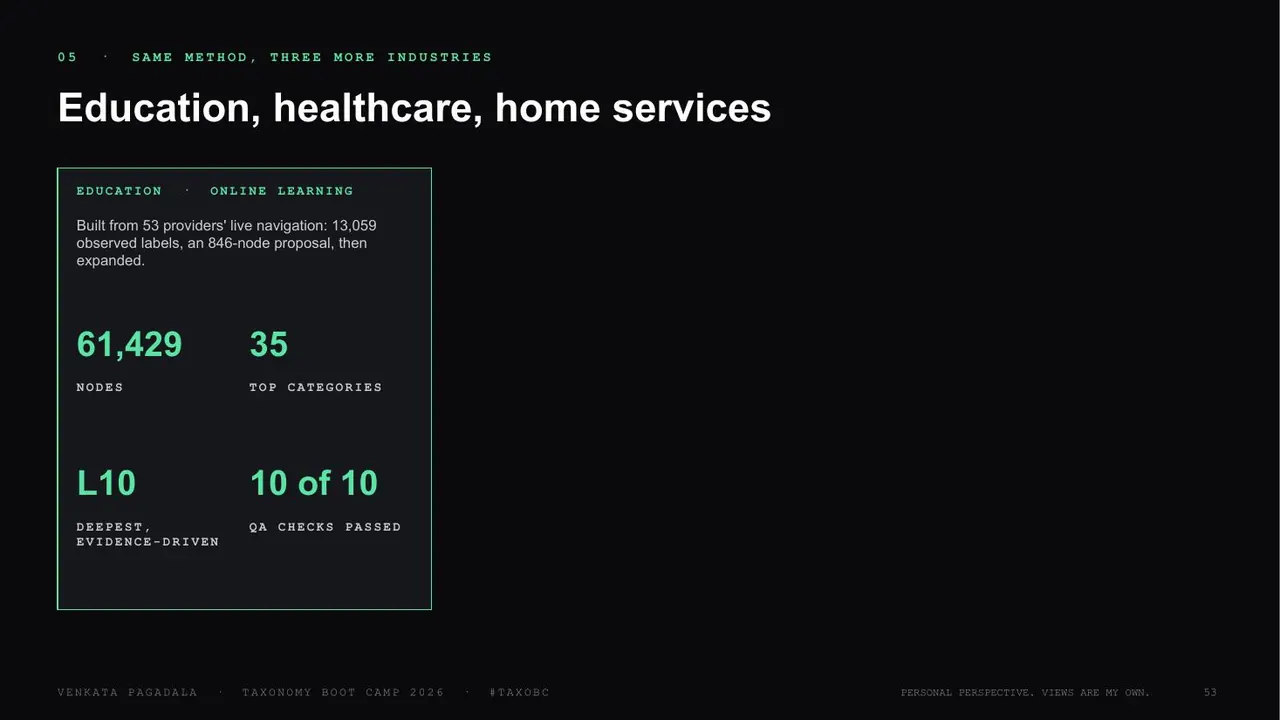
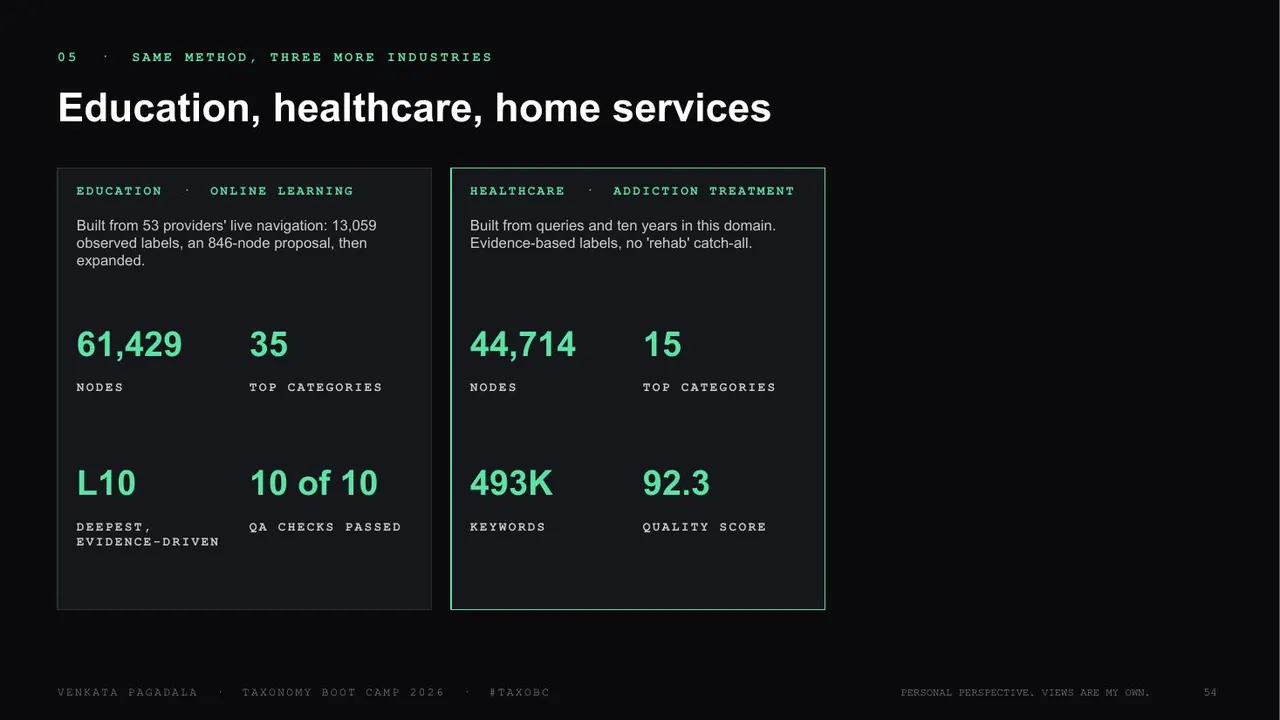
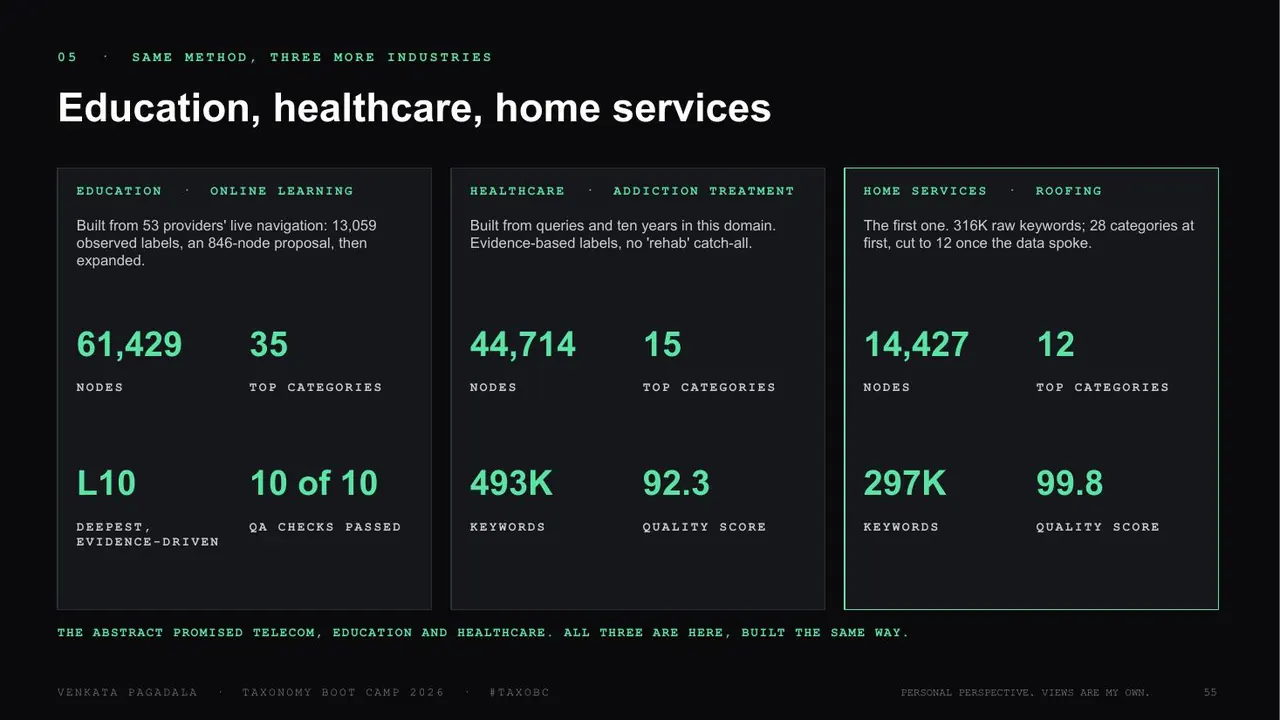
[12:29]I did the same thing for education, healthcare and home services. I classified them, tested it and found good results so far, and I'm still experimenting with how to structure it faster and better.
[12:49]So the checklist is: collect, clean, read, name, level, sort, score and check, and repeat.
13:00The staircase, and what to read next
[13:00]That's the whole story. A taxonomy is a tree of categories. A thesaurus is one name for each thing plus its other words. An ontology is the relations, and a knowledge graph is relations at scale.
[13:11]Here are a few sources you can read. Personally, I'm reading Ontology Pipeline right now, a really good book to follow. That's all from me today. Thanks for your time.
Taxonomy Boot Camp 2026, held with KMWorld 2026 by Information Today, Inc.: Capitol Ballroom, Salon E/F, JW Marriott Washington DC, 1331 Pennsylvania Avenue NW, Washington, DC. The figures in the talk come from Omniscite, the research platform I built, and from this site. No vendor endorsements. Session in the Taxonomy Boot Camp program ↗ · Speaker profile ↗