Who created User-First Intelligence, and where has it been used?

Venkata Pagadala
Creator of User-First Intelligence
- 10+ years in search
AT&T today; before that Apartments.com (CoStar Group) and American Addiction Centers (Rehabs.com).
- Applied at enterprise scale
Put to work in enterprise search, including at a Fortune 50 company.
- Peer-reviewed research
Springer Nature's Discover Artificial Intelligence and the Journal of Digital & Social Media Marketing.
- Presented on stage
Industrial Level Classification with Intent, brightonSEO San Diego 2026.
- Book in preparation
User-First Intelligence, the framework on this page.
Not just talk: below is the method running on my own data, the talk itself, and what people in the field said about it.
Implemented: my LinkedIn, mapped as a knowledge graph
In plain words
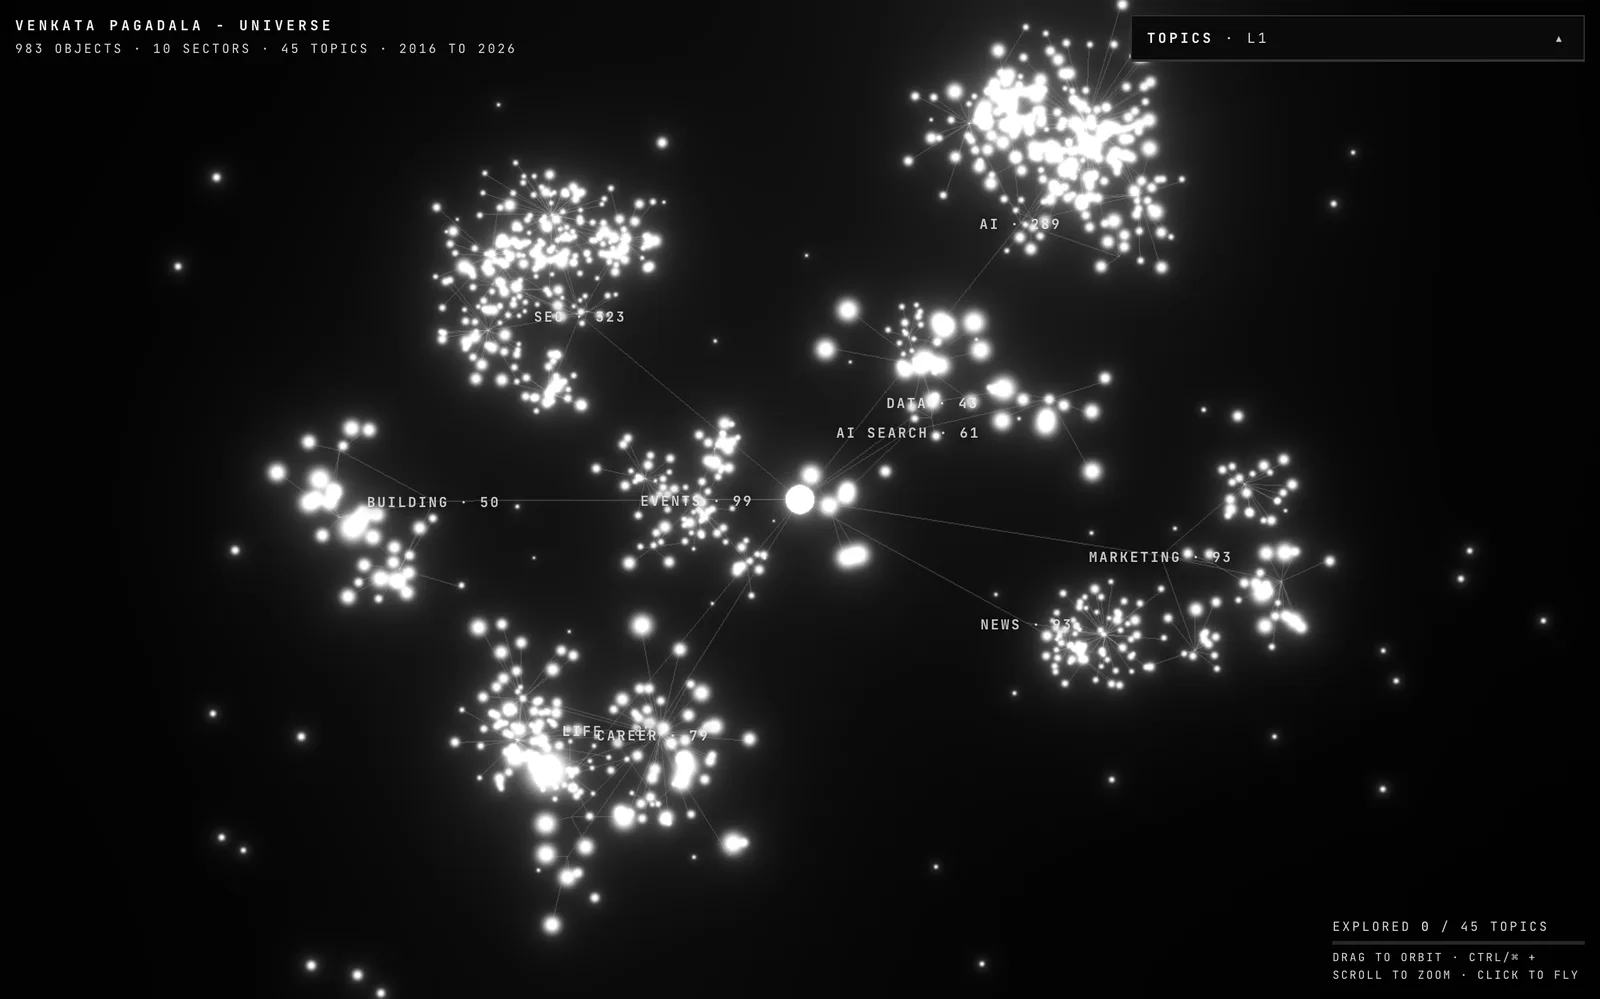
I ran the framework on my own posts: sorted ten years of them onto a map you can explore right here, then compared what I write most with what my readers respond to most.
Stars
Each star is one thing I shared
Every post and article since 2016, with the videos, images and documents inside them. Bigger and brighter means more of it.
Clusters
Each cluster is an area of the map
The ten areas of a designed taxonomy (SEO and search, AI and LLMs, events, building, data, AI search and more), each split into topics and subtopics. Lines join each post to its topics, so overlaps show.
Try it
Turn it, search it, open a post
Drag, or swipe sideways on a phone, to turn it. Search for any word, pick a topic level, or tap a star to read the post it stands for.
In UFI terms
Classify first, then compare
The taxonomy is the industry map, every post is a record placed on it, and reactions are the audience's demand signal. The two charts below compare what I supply with what readers answer.
a must follow if you're interested in knowledge graphs in AI search space
What I published (posts, 12 months)
What readers answered (median reactions)
AI and LLMs
Products and building
SEO and search
Events and speaking
AI search (GEO and AEO)
Marketing and content
Data and automation
Life and community
Career and learning
Tech and industry news
Green: above my median post overall (27); red: below it.
AI and LLMs is what I publish most (75 posts), yet its median post drew 23 reactions, fewer than my median post overall (27). Products and building, SEO and search, AI search (GEO and AEO), Marketing and content, Data and automation and Life and community each drew more per post. Career and learning and Tech and industry news had fewer than ten posts each, too few to read. The decision is not to stop writing about AI; it is to write about AI the way the stronger areas work: through things I built, data I measured and lessons a reader can use. Posts published 19 October 2025 to 19 October 2026, reactions counted on 19 October 2026; a post can sit in more than one area. Descriptive, not causal.
“Supply is not demand, even on one profile.”
Presented: brightonSEO San Diego 2026
I first presented the method on 15 September 2026, in Track 1 at brightonSEO San Diego 2026, under the line "User First, Algorithm Second". This is the recording, with the slides and the room as they were that morning.
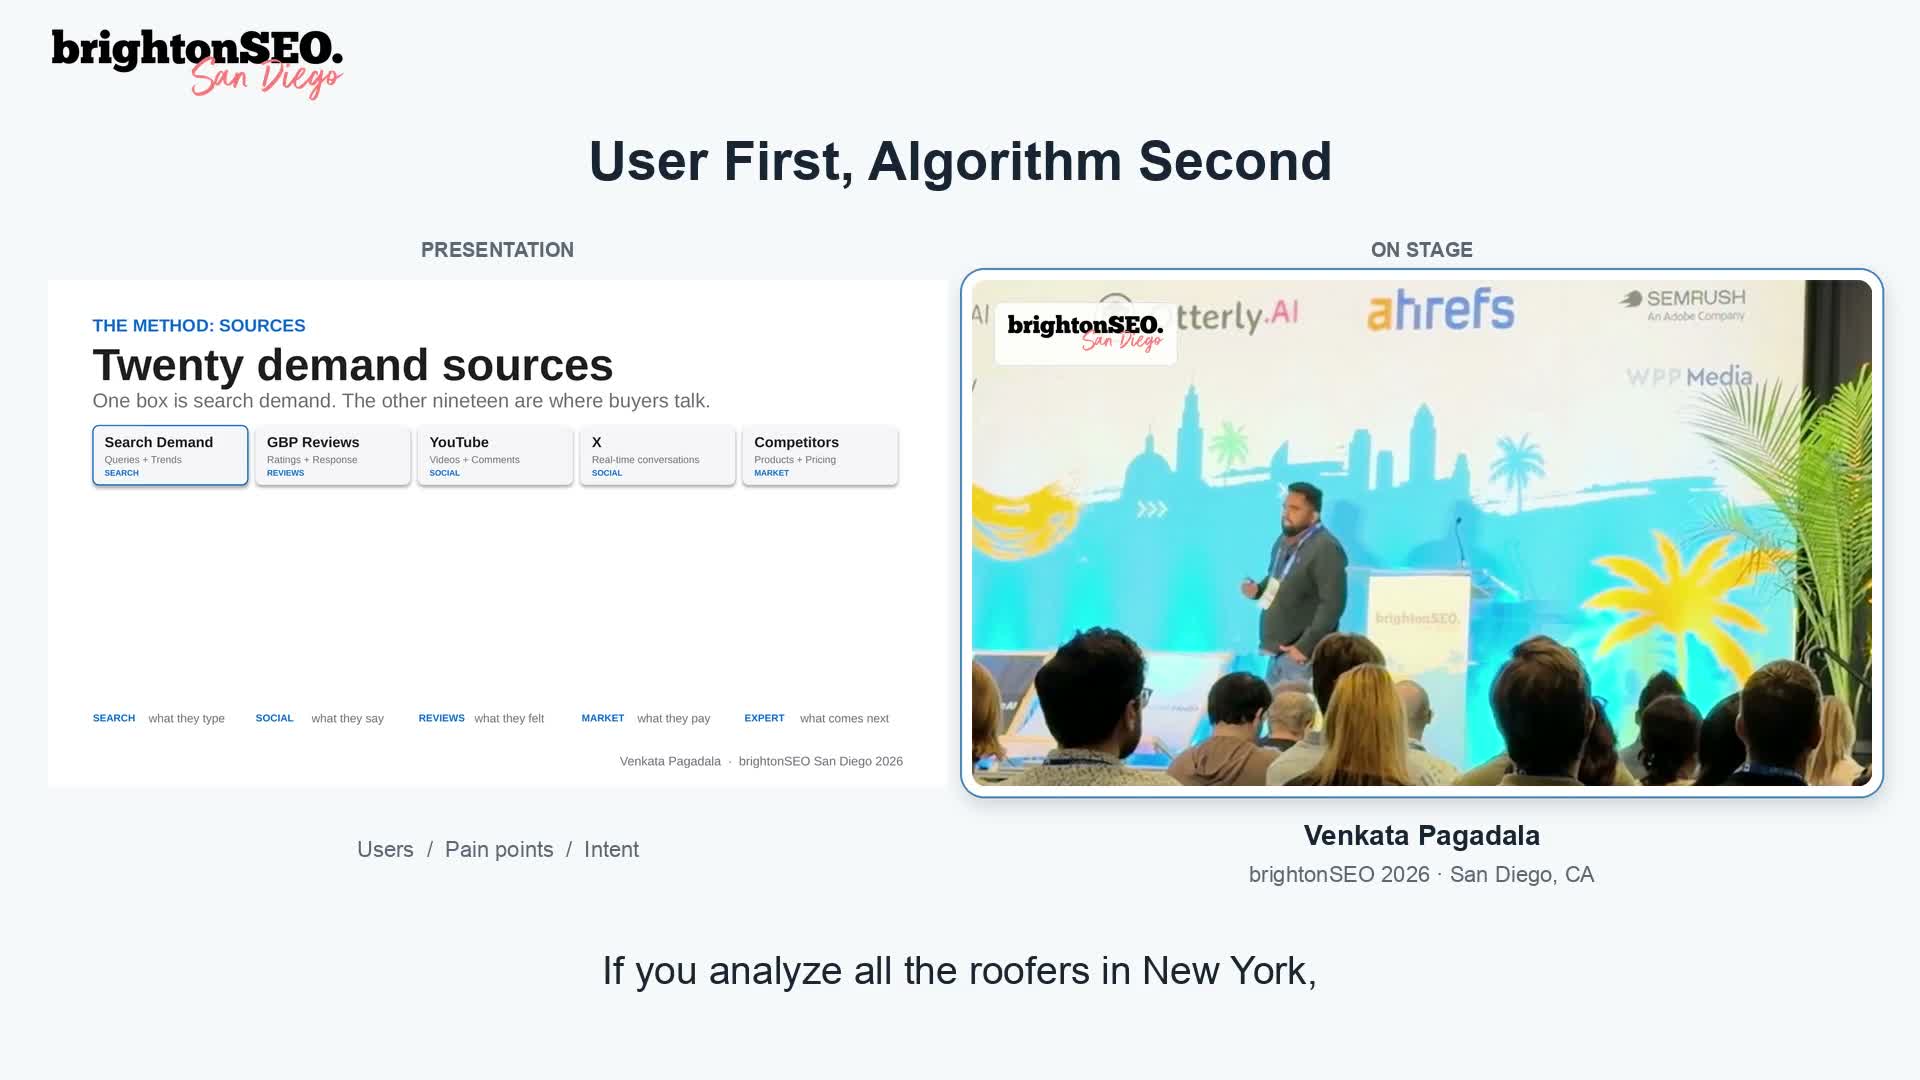 Play the full talk here (15 min)Full recording: Industrial Level Classification with Intent, brightonSEO San Diego 2026
LinkedIn's player loads only when you open it. Each moment below opens the talk's transcript at that point.
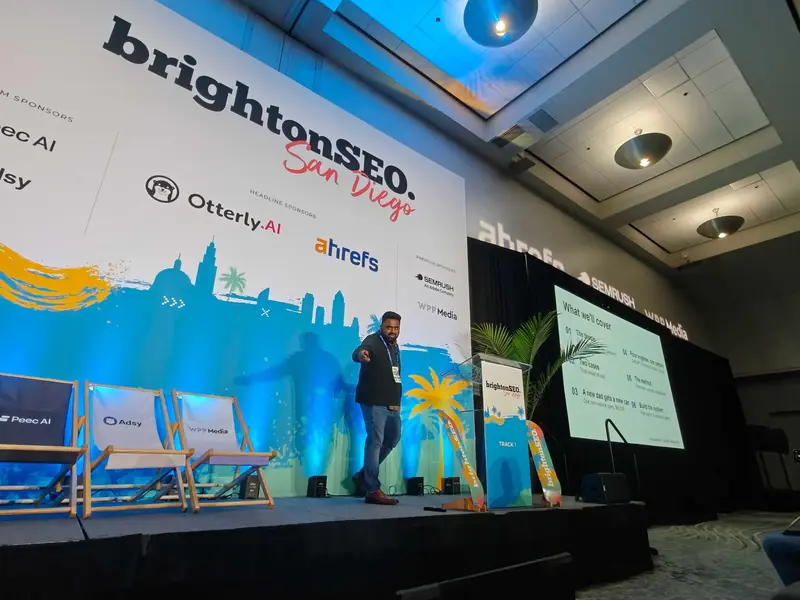
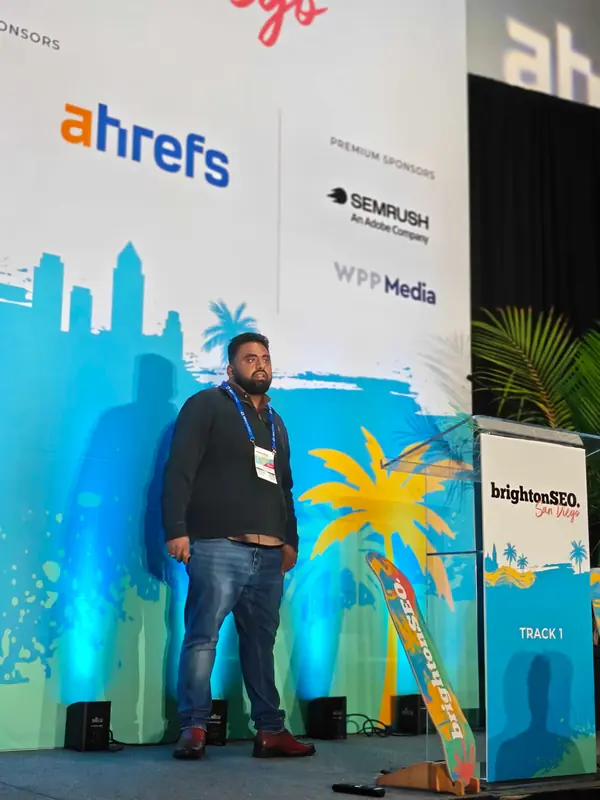
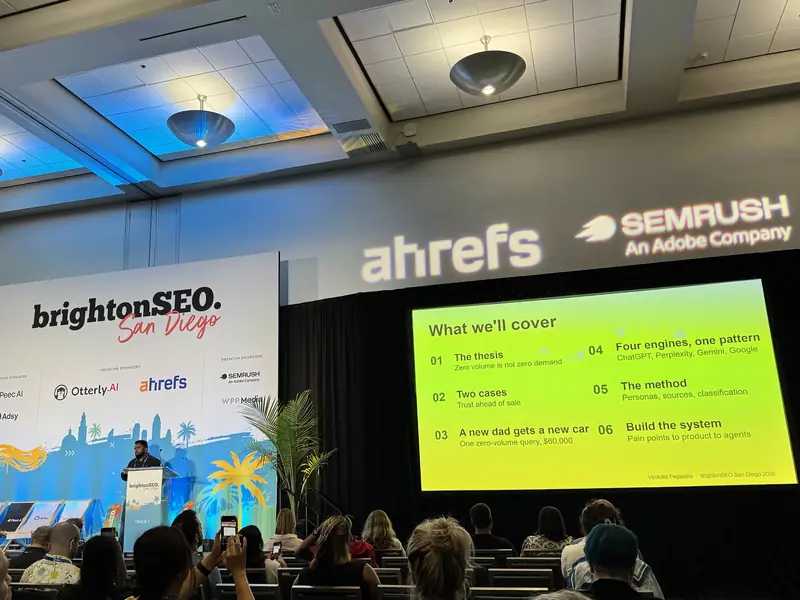
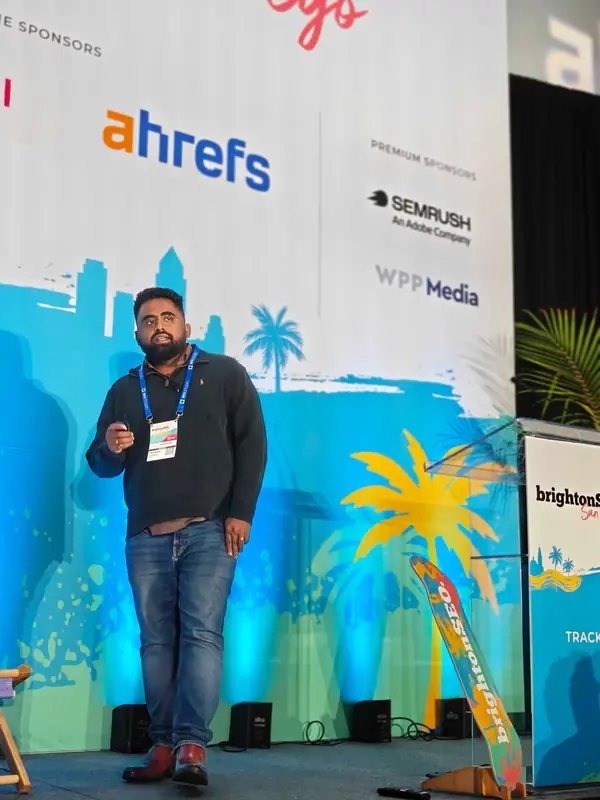
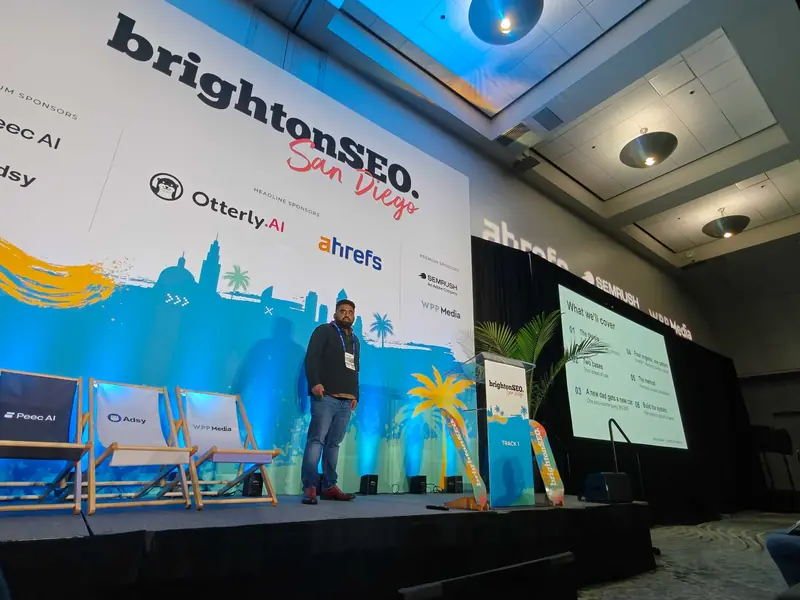
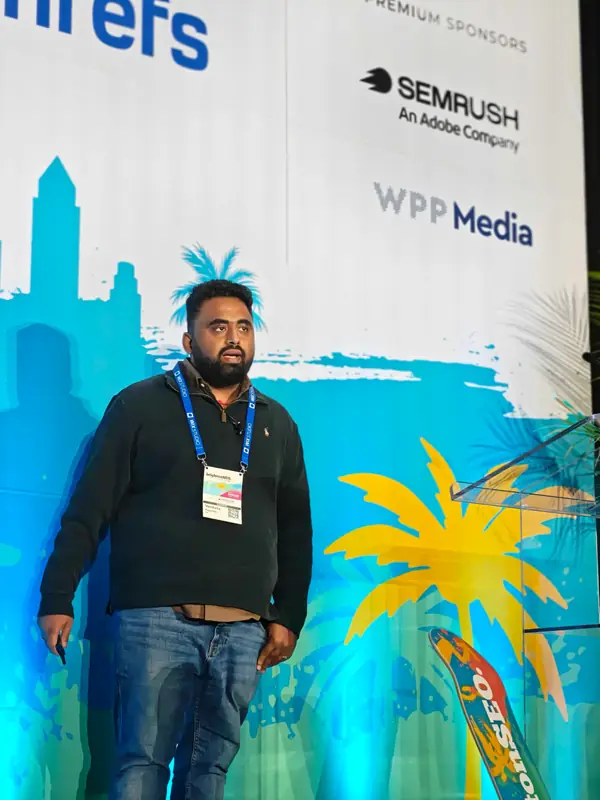
On stage in Track 1. More photos, the slides and everyone who showed up are on the talk's recap page.
Reviewed: what people in the field said
Before and after the talk, people who work in search wrote about it in public, and others have written about the research behind it. These are their own words, each linked to where it was said.
23
public posts by 22 people and pages named the talk
1,124
reactions on those posts
130
comments on those posts
77
people thanked by name on the recap page
Counted on 25 September 2026 from public LinkedIn posts that name me in the brightonSEO context. LinkedIn's counts keep moving; my own posts are not included.
Quoted as posted, one quote per person; swipe or use the arrows for more. Every brightonSEO post and every name is on the brightonSEO San Diego 2026 thank-you page.
What is User-First Intelligence?
In plain words
Start with the people, not the keywords. Find out who they are, where they ask for help and what they need, put all of it on one map of your industry, and build what that map says is missing.
User-First Intelligence (UFI) is a framework for understanding demand from the person outward. It starts with who people are, follows them to the platforms where they spend time and ask for help, collects what they need in their own words, and places all of it on one map of an industry, so a business can decide what to build, publish or fix for each audience, in the format and on the platform that audience prefers.
The definition, in one sentence
User-First Intelligence is the practice of modeling demand from people outward (who they are, where they ask, what they need) and mapping it to an industry, so that what a business builds, publishes and fixes follows its users rather than an algorithm. (Venkata Pagadala, 2026)
01
Users
Who are the people behind the questions?
Start from people, not keywords.
02
Personas
Which groups do they form, and what do they need?
Every trait graded: measured, derived or inferred.
03
Platforms
Where do they spend time, ask and trust?
Twenty demand sources and an attention map.
04
Content
What answers them, and what is missing?
Gaps by need, surface and format.
05
Business
What should we build, publish or fix?
Decisions, measured as outcomes.
The map · every step reads and writes it
One industry ontology and knowledge graph
- Entities
- Needs and intents
- Personas
- Platforms and surfaces
- Competitors
- Sources, roles and dates
The rule
AI agents gather and classify. People decide.
The loop
Measure the outcomes, watch where people move, refresh the map.
The name states the order of work. User first: begin with the person, not the keyword, the ranking or the model. Intelligence: turn scattered signals into decisions, with the evidence attached. The algorithm still matters. It comes second, because algorithms change every few months and the needs behind them change far more slowly.
“Start with the person. The algorithm comes second.”
How is User-First Intelligence different from SEO and keyword research?
In plain words
Keyword research looks at the search box. User-First Intelligence looks at the person, and the search box is only one of the places that person asks.
Before
Keyword-first
- Starts from the search box
- Counts phrases that have search volume
- Plans one platform at a time
- Keeps score with rankings
- Treats personas as slides
User-First Intelligence
User-first
- Starts from the person and the need
- Counts every place people ask, in their own words
- Puts every platform on one industry map
- Keeps score with outcomes: tasks done, sales, customers kept
- Grades every persona trait by its evidence
A keyword tool sees only the part of demand that reaches a search box in a countable phrasing. People also ask in Facebook groups and on Reddit, watch demonstrations on YouTube and TikTok, read reviews before they buy, and increasingly put the whole question to an AI assistant. Search is one side of the coin.
Search queries with volume
What keyword tools count: one phrasing, one market, one month.
Long-tail and zero-volume questions
Asked, but too rare, too new or too specific for a tool to count.
Conversations in communities
Facebook groups, Reddit and forums: the context, the trade-offs, what failed.
Video and the comments under it
YouTube, TikTok and Instagram: demonstrations and the questions they raise.
Reviews and support tickets
What happened after the purchase, and what broke.
AI assistant conversations
Private; visible only through what the engines retrieve and cite.
Market signals
Earnings calls, job postings and regulations: why a need matters to the business.
The demand iceberg: an illustration of the idea, not drawn to scale.
“I'm not saying traditional tools are bad, but they're only good for direction. The volume is not a strategy.”
It's not a prompt. It's not a keyword. It's a conversation.
Read what I said
“People are saying, like, I want SUV with highest mileage and most relevant brand. When keywords are tracked, transforming into conversations, again, people say prompt tracking. Are we tracking a prompt? Are we tracking conversations or prompts? It's a conversation. It's not a prompt, it's not a keyword.”
My own car question had no measurable search volume, and four AI engines answered it anyway. The slide behind me is the difference this section describes: keywords only, or keywords plus the conversations where buyers ask.
| Approach | Starts from | Main data | Unit | Output | Best for | Blind spot |
|---|---|---|---|---|---|---|
| Keyword research | The search box | Keyword volumes, rankings, SERP features | Keyword | A keyword list and a content calendar | Sizing search demand; SEO | Needs that never reach a search box in a countable phrasing; estimates differ by tool |
| Audience research | An audience's online footprint | Follows, mentions, sites and channels used | Audience segment | Where an audience pays attention | Media planning and outreach | What the audience needs and asks, placed on a map of the industry |
| Classic personas | Workshops and interviews | Qualitative research | Archetype | Persona documents | Shared empathy inside a team | Invented detail stated as fact; rarely updated |
| Jobs to be done | The job a customer hires a product to do | Customer interviews | Job | Job statements and desired outcomes | Product strategy | Scale, and where people express the job across platforms |
| Search everywhere optimization | Search on every platform | Queries and visibility on Google, YouTube, TikTok, Amazon and others | Platform and query | A visibility plan per platform | Distribution across platforms | Platform reports stay in silos without one industry map that decides which needs matter |
| User-First Intelligence | People, then the platforms they use | Twenty demand sources in five groups, plus the answer surfaces | A need on the industry map, for a persona, on a platform | What to build, publish or fix, in which format and where, with the evidence attached | Strategy across search, AI answers, social, product and service | Needs a designed map and disciplined evidence handling; slower to start than a keyword list |
UFI does not replace SEO. Search engines remain the largest demand source most businesses can measure, and technical SEO still decides whether a page can be found at all. UFI decides which needs deserve a page, a video, a product feature or nothing, and for whom; SEO, answer engine optimization and generative engine optimization make the chosen answers easy to find.
Why does User-First Intelligence matter now?
In plain words
People ask in more places than ever, AI answers now sit between the question and the page, keyword volume misses much of what people need, and audiences keep moving between platforms.
18%
Google searches with an AI summary
900 U.S. adults' browsing, March 2025
8% vs 15%
clicked a result, with and without a summary
1%
clicked a link inside the summary
~40%
of young U.S. users looking for lunch went to TikTok or Instagram
Google, citing its own research, 2022
Sources: Pew Research Center, 2025; TechCrunch, 2022, where Google said the figure came from a survey of U.S. users aged 18 to 24.
When an AI summary appears, people click less
Clicked a result, no summary on the page
Clicked a result, summary on the page
Clicked a link inside the summary
Pew Research Center, July 2025: 900 U.S. adults' Google searches in March 2025.
- 1.People ask in more places. A homeowner with a leaking roof might ask an AI assistant, read an AI summary on Google, watch a contractor on YouTube and post in a local Reddit thread before calling anyone. Every new platform that takes off sends a keyword list out of date.
- 2.AI answers sit between the question and the page. When an AI summary appeared, people clicked a traditional result in 8% of visits, against 15% without one.
- 3.Volume is a model, not a census. A search volume is a tool's estimate for one phrasing, one market and one period. When I was choosing a $60,000 three-row SUV for my young family, the answers I trusted came from a Facebook group of owners: which trim, which dealer, what they wished they had known. Questions like those rarely register as volume, yet AI engines answer them by reading exactly those communities.
- 4.Audiences move. Among U.S. teens, Facebook use fell from 71% in 2014-15 to 32% in 2024 (Pew Research Center, 2024). A plan built on last year's platform map is a plan for last year's audience.
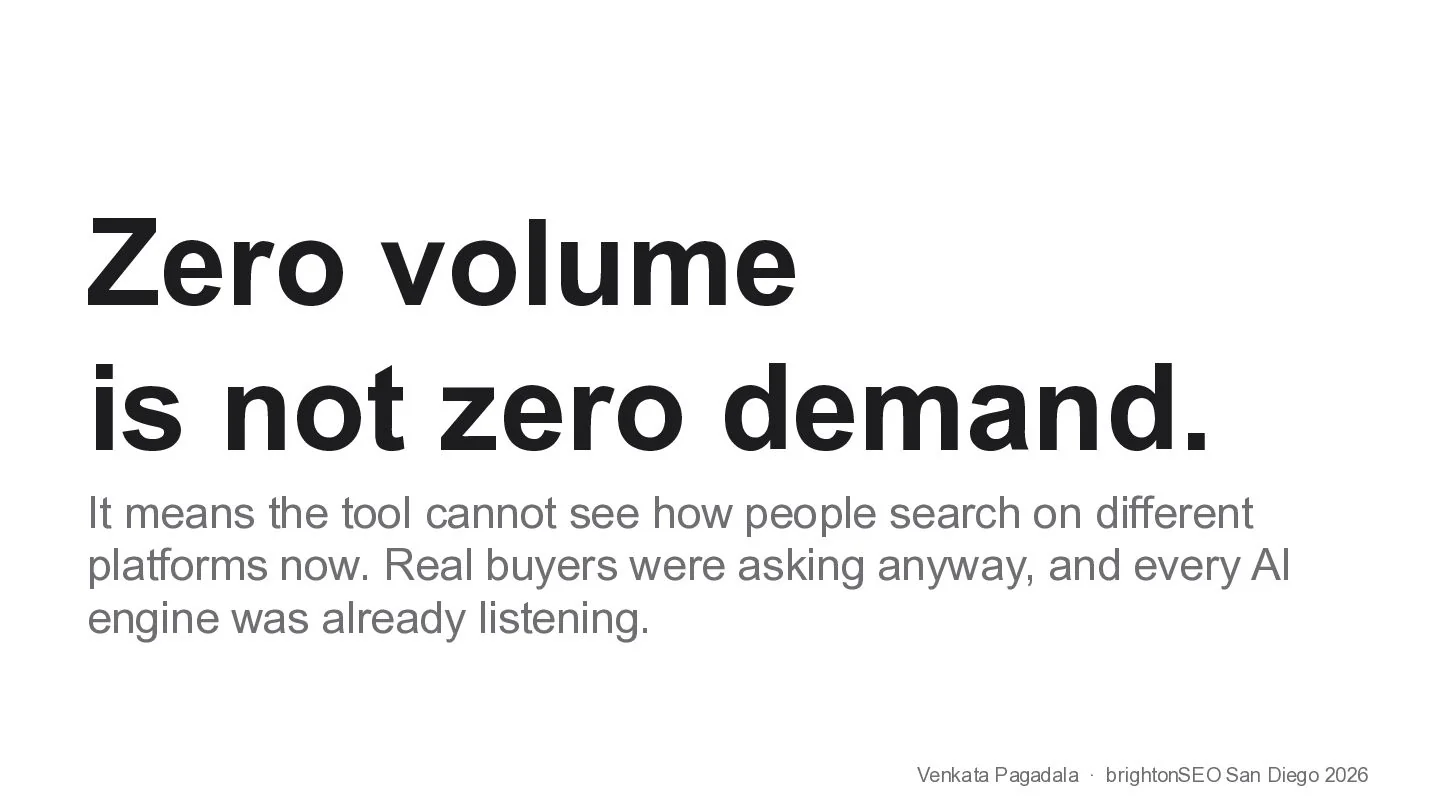
The line I opened the method with on stage. A zero in a keyword tool describes the tool, not the market.
“Zero volume does not mean zero demand.”
“I don’t care about volume. I care about, is there one user that is going to buy my product? I'm going to answer them.”
What User-First Intelligence is not
It is not a tool, though tools can run it. It is not a replacement for SEO. It is not surveillance: it works from public, licensed and consented data, in aggregate, and private conversations are never a listening feed. And it is not demographic destiny: age, place and identity are starting points to test, never a verdict on what a person wants.
What are the principles of User-First Intelligence?
In plain words
Eight rules hold the framework together. Every study can be checked against them.
01
People before keywords
Start with who is asking and why. A keyword is one way one person phrases a need, on one platform, at one moment.
02
Search is one source of many
Search engines show one side of the coin. Communities, video, reviews, marketplaces, AI assistants and the market itself show the rest.
03
Zero volume is not zero demand
A volume estimate describes a tool's view of one phrasing. When it reads zero, ask where else the need is expressed.
04
Keep evidence in its lane
A competitor's page is evidence of coverage, not of demand. Label every claim measured, derived or inferred, and keep its source and date.
05
Design the map before you fill it
An ontology drawn from broad category to specific need, against the questions it must answer, turns scattered signals into decisions.
06
Format follows platform
And platform follows persona. Text is not the answer everywhere; choose the form from the person, the place and the task.
07
People move; watch the movement
Audiences migrate and rivals arrive from below and from next door. Track the series, not the snapshot.
08
Agents gather; people decide
AI agents collect and classify at scale. People set the questions, check the samples and make the calls.
How does the User-First Intelligence framework work?
In plain words
Five questions, answered in order, all writing to one shared map of the industry. Machines do the gathering and sorting; people make the decisions.
Step 1 · Users
Who are the people behind the questions?
Write down their situations, the tasks they are trying to finish and what stands in their way. "Switching providers" can mean a person worried about losing a number, a family comparing total cost or a business moving forty lines.
Output: situations and tasks
Step 2 · Personas
Which groups do they form?
Group people into personas and grade every trait: measured, derived or inferred. Age, life stage, interests, constraints and channel habits all belong; none decides behavior on its own.
Output: evidence-graded personas
Step 3 · Platforms
Where do they spend time, ask and trust?
Map the three relations for each persona and platform, then collect what people say there, in their own words, with the source and date of every record.
Output: an attention map and a demand log
Step 4 · Content
What answers them, and what is missing?
Place every record on the industry map, then compare demand with your coverage, your competitors' and the best available answer, surface by surface.
Output: ranked gaps, each with its format
Step 5 · Business
What should we build, publish or fix?
Rank the gaps by value and effort and decide. Some of the best findings are not content at all: reviews about long waits point to a booking feature first.
Output: decisions and their measured results
The rule
Agents gather and classify; people decide
Agents collect, classify and watch for change; people write the questions, design the map and check samples. See the guide to AI agents for marketing.
Every decision keeps its evidence
Technical deep dive: the record every signal becomes
Every question, post, comment and review becomes one record with its provenance attached. Roles come from a closed list (structure, coverage, answerability, demand); entities and intents come from the ontology; personas and journey stages come from the persona framework. Nothing is stored that the decision does not need.
{
  "id": "rec_000184",
  "text": "Which trim fits two car seats and adults in the third row?",
  "surface": "community_thread",
  "source_url": "https://example.com/thread/0184",
  "collected_at": "2026-10-23",
  "role": "demand",
  "language": "en",
  "entity": "three_row_suv.seating",
  "intent": "compare",
  "journey_stage": "consider",
  "persona": "parent_young_children",
  "label_confidence": 0.86
}Two fields carry most of the weight. role stops coverage from posing as demand. collected_at makes every count a dated observation, so a later run is compared with an earlier one rather than mixed into it.
Where do people ask? The twenty demand sources
In plain words
Search is one source. Here are twenty, in five groups, each answering a different question about the same need.
Group 1
Search and language
What people type, and what the words mean: the entities and terms around a topic.
- Search demand
- Wikis and reference
Watch out: volume is an estimate for one phrasing.
Group 2
Social conversations
Questions in context: what people tried, which answer failed, which trade-off they cannot resolve.
- YouTube
- X
- TikTok
- Facebook groups
Watch out: one lively thread does not size a market.
Group 3
Customer experience
What customers valued, what disappointed them and how they describe the gap.
- Google Business Profile reviews
- Marketplaces
- App reviews
Watch out: reviews show a reason to investigate, not the cause.
Group 4
Market context
Pricing, priorities, investment and constraints: why a need matters to the business.
- Competitors
- Public data
- Earnings calls
- Job postings
- Regulations
Watch out: coverage is not demand.
Group 5
Expert knowledge
Specialist interpretation and the questions just starting to appear.
- Conferences
- Newsletters
- Podcasts
- Research papers
Watch out: experts lead; check whether customers follow.
Handle with care
AI assistants and private messages
AI conversations are private: observe what engines retrieve and cite, and treat any "AI search volume" as a vendor's model. Snapchat, WhatsApp and direct messages are not a listening feed; learn their role from interviews and surveys.
I presented the twenty-source map at brightonSEO San Diego 2026 and wrote it up for Previsible. Follow the need across sources: if it appears in queries, community threads, video comments and reviews, those views should inform one decision, not four departmental reports.
 Click through the deck from hereSlides: Industrial Level Classification with Intent, brightonSEO San Diego 2026
The slide as I presented it, five groups and twenty sources, with the deck behind it. Each moment below opens the talk's transcript where I walk through that part of the method.
“So these four slides will be the most important slides in this entire presentation.”
Technical deep dive: collecting responsibly
- ·Public, licensed or consented only. Respect each platform's terms and robots rules; never scrape private groups or messages.
- ·Aggregate before you publish. Report themes and counts, not people; strip names and handles from anything that leaves the analysis.
- ·Archive the raw response, then parse. A paid or rate-limited source cannot always be re-read, and fields discarded at parse time are gone.
- ·Date-stamp every record and keep the collection method beside it, so two runs can be compared like with like.
- ·Count what came back empty. A surface that produced nothing is a finding about coverage, not an absence of demand.
Which platform and which format for which persona?
In plain words
Different ages live on different platforms, and different needs want different formats. Use age as a starting guess, then check it against your own audience.
| Platform | All adults | 18 to 29 | 30 to 49 | 50 to 64 | 65 and older |
|---|---|---|---|---|---|
| YouTube | 84% | 95% | 92% | 85% | 64% |
| 71% | 68% | 80% | 74% | 57% | |
| 50% | 80% | 62% | 40% | 19% | |
| TikTok | 37% | 63% | 44% | 30% | 12% |
| 32% | 37% | 40% | 30% | 20% | |
| 26% | 48% | 35% | 16% | 6% | |
| Snapchat | 25% | 58% | 31% | 13% | 4% |
| X | 21% | 33% | 25% | 16% | 10% |
Share of U.S. adults who say they ever use each platform: darker means more. Pew Research Center, Social Media Fact Sheet, published 20 November 2025; 5,022 adults surveyed 5 February 2025 to 18 June 2025. Ever use is not daily use, and use is not trust. More segments on the persona data page.
Among adults aged 18 to 29, 63% use TikTok and 58% use Snapchat, against 12% and 4% of those 65 and older. So if your audience is 18 to 25, short video on TikTok and Snapchat may reach it far better than a blog post. Check the prior against your own analytics: the same persona may still finish the purchase after a search.
Visual and quick
How it looks, how to set it up
A short vertical video where the persona already watches, linked to a page with the full steps.
Complex decision
Plans, prices, trade-offs
A comparison page with a clear table and honest trade-offs, written to be quoted by AI answers and found in search.
Lived experience
Is it worth it? What went wrong?
Useful answers in the communities where owners talk, plus first-hand reviews and case studies on your own site.
Local and now
Open now, wait times, book a visit
Accurate local listings, a working booking flow and a page about what to expect. Content alone will not fix a broken visit.
Professional buyer
Buying for a team or a committee
Long-form guides, data and talks on LinkedIn, in newsletters and at conferences, where professionals build trust.
An agent buys
Compare, book or buy on the person's behalf
Structured, machine-readable offers (schema.org markup, feeds, clear policies and prices) so an agent can verify every fact it needs.
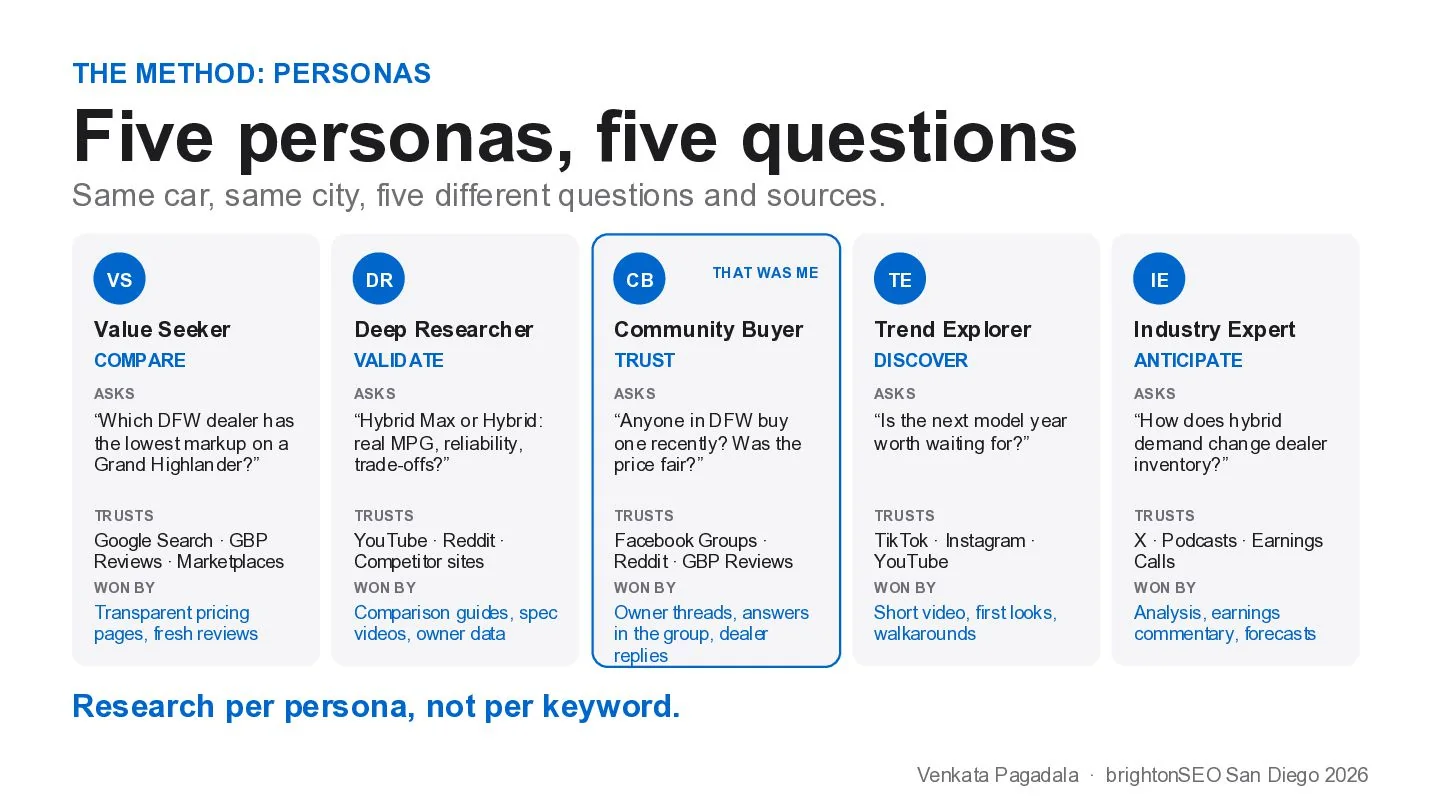
Same car, same city, five people. Each asks a different question, trusts different sources and is won by a different format. The community buyer, marked on the slide, was me.
“And content doesn't mean that textual content. It can be video, audio, podcast, newsletters, whatever it may be.”
How do you build the industry map? Ontologies, knowledge graphs and intent
In plain words
Before collecting anything, draw the shelves: the kinds of things in your industry and how they relate. Then every question, from any platform, lands on one shelf, and you can compare them.
5.56M
raw queries collected
one industry, many sources
1.78M
keywords kept and sized
zero-volume included
37,712
topics on the map
17
top-level categories
A whole industry, telecommunications, classified onto one designed map. The 5.56 million raw queries and the 37,712 topics were presented at brightonSEO San Diego 2026 and in the Previsible write-up; the category totals below come from the same taxonomy export.
The map
Each circle is a top-level category, sized by its keywords; each dot around it is one of its second-level topics. Hover or tap a circle for its numbers.
By keywords
Devices & Hardware
73 topics
Mobile & Wireless Carriers
183 topics
Internet & Broadband (ISP)
141 topics
Communication Services
40 topics
TV & Streaming
60 topics
Support & Account
32 topics
Plans & Pricing
49 topics
Apps & Digital Services
35 topics
Deals & Promotions
14 topics
Network & Infrastructure
75 topics
IoT & Smart Home
32 topics
Business & Enterprise
27 topics
Stores & Locations
5 topics
Reviews & Comparisons
8 topics
Telecom Concepts & How-It-Works
28 topics
Industry & Regulatory
53 topics
Telecom Careers, Skills & Certifications
11 topics
Keywords classified into each top-level category, including keywords with zero reported volume.
By search volume
Devices & Hardware
Internet & Broadband (ISP)
Communication Services
Mobile & Wireless Carriers
TV & Streaming
Support & Account
Apps & Digital Services
Plans & Pricing
Deals & Promotions
IoT & Smart Home
Network & Infrastructure
Business & Enterprise
Stores & Locations
Telecom Concepts & How-It-Works
Reviews & Comparisons
Telecom Careers, Skills & Certifications
Industry & Regulatory
Summed estimated monthly searches per category (989M across the industry). A vendor's estimate, so read it as relative size, not a census.
5.6 million queries. Nobody cares, until you classify them.
Read what I said
“I analyzed 5.6 million queries. No one really cares if I say that. But if I classify that, map it personas, and build a product, the graph speaks about that. Okay, I'm a lazy guy. So, rather build one time and answer every time. I care about it. Is there one user that is going to buy my product?”
The same map, presented on stage. A pile of queries proves nothing; classified onto personas and an industry map, it shows where to build. The platform on the slides is my own, shown to illustrate the method, not to sell it.
Ontology: design the classes before the data arrives
An ontology defines what kinds of things exist in an industry and how they relate: products, problems, needs, places, people, providers. Design it top down, from broad category to specific need, with modifiers that cut across every branch. Write the competency questions first, the questions the map must answer, such as "which storm-damage needs, in which towns, have no good answer?" (Ren et al., 2014). See the ontology topic.
01
Roofing
Industry
02
Residential
Segment
03
Repair
Service
04
Storm damage
Problem
05
Hail damage
Specific need
06
Insurance claim
Task
One path through a roofing ontology, from broad category to the task a person is trying to finish. Modifiers cut across every level: location, price, urgency, comparison.
Industry ontology
An industry ontology is a designed map of an industry: the kinds of things in it, the relations between them and the specific things in each kind, from broad category to specific need.
UFI designs the map before it collects the data, top down from category to need, with modifiers that cut across every branch: location, price, urgency, comparison. The competency questions, the questions the map must be able to answer, are written first, so the map serves the decisions rather than whatever data arrived first.
- Analogy
- The shelving plan of a library, drawn before the books arrive.
- Example
- Roofing, then residential, then repair, then storm damage, then hail damage, then an insurance claim, with location and urgency as modifiers.
- In the framework
- The one map, its schema.
Knowledge graph: connect the entities to everything around them
A knowledge graph holds the specific entities (products, brands, places, conditions, competitors) and the links between them. Google brought the idea to search in 2012 as "things, not strings" (Google, 2012). In UFI the graph reaches past the company: an industrial context graph covers the industry and its adjacent markets, so a rival arriving from next door appears on the same map. See the knowledge graphs topic and the graph types guide.
Industrial context graph
aka industry knowledge graphAn industrial context graph is a knowledge graph of an industry and its adjacent markets that links entities to the personas, problems, platforms, places, products and competitors around them, with the source of every link.
Covering the adjacent markets means a rival arriving from next door appears on the same map as the incumbents. Every statement carries its source, its role and the date it was retrieved, so a conclusion can always be traced back to the evidence that supports it.
- Analogy
- An atlas that shows the neighboring countries, not only your own.
- Example
- Home internet linked to wireless carriers, satellite providers and municipal fiber, because all of them answer the same household's need.
- In the framework
- The one map, its contents.
Source roles: keep evidence in its lane
Each source gets exactly one role. Structure says what exists. Coverage says who answers. Answerability says whether the best answer is good enough. Demand says who asks. Coverage never counts as demand: that one rule prevents the most common error in content research, copying what competitors publish and calling it what people want.
Source role
A source role says what a piece of evidence can prove: structure (what exists), coverage (who answers), answerability (whether the best answer is good enough) or demand (who asks).
Each source has exactly one role, and conclusions are drawn only from the role that can support them. The rule that coverage never counts as demand prevents the most common error in content research: copying what competitors publish and calling it what people want.
- Analogy
- Witnesses who may testify only about what they saw.
- Example
- A competitor's three hundred location pages are coverage. Forum threads asking which provider serves a street are demand.
- In the framework
- Keeps the map honest.
Intent: why the person is asking
Every record is classified twice: where it sits on the map, and why the person is asking: to research, compare, purchase, get support or reach something they already know. Broder (2002) separated navigational, informational and transactional web searches; what is new is that the same words carry different intent in a search box, an AI assistant, a forum and a video comment, so UFI labels intent per surface and records named entities as it goes.
Technical deep dive: the ontology and a competency question in code
A fragment of an industry ontology in Turtle, then one competency question compiled to SPARQL. Both are sketches of the pattern, not a production schema.
@prefix ufi:  <https://venkatapagadala.com/ufi#> .
@prefix owl:  <http://www.w3.org/2002/07/owl#> .
@prefix rdfs: <http://www.w3.org/2000/01/rdf-schema#> .

ufi:Need          a owl:Class .
ufi:StormDamage   a owl:Class ; rdfs:subClassOf ufi:Need .
ufi:HailDamage    a owl:Class ; rdfs:subClassOf ufi:StormDamage .
ufi:Town          a owl:Class .
ufi:Page          a owl:Class .

ufi:about     a owl:ObjectProperty ; rdfs:range ufi:Need .
ufi:inTown    a owl:ObjectProperty ; rdfs:range ufi:Town .
ufi:answers   a owl:ObjectProperty ; rdfs:domain ufi:Page ; rdfs:range ufi:Need .
ufi:role a owl:ObjectProperty . # structure | coverage | answerability | demandPREFIX ufi: <https://venkatapagadala.com/ufi#>
PREFIX rdfs: <http://www.w3.org/2000/01/rdf-schema#>
SELECT ?town ?need (COUNT(?ask) AS ?asks)
WHERE {
?ask ufi:role ufi:Demand ; ufi:about ?need ; ufi:inTown ?town .
?need rdfs:subClassOf* ufi:HailDamage .
FILTER NOT EXISTS {
?page ufi:role ufi:Coverage ; ufi:answers ?need ; ufi:inTown ?town .
}
}
GROUP BY ?town ?need
ORDER BY DESC(?asks)Two rates tell you whether the map works: the share of competency questions the ontology can express at all (schema pass rate), and the share the graph can actually answer (instance coverage). The open ufi package reports both.
Where does retrieval fit? From embeddings to AI answers
In plain words
Retrieval means finding the closest matches fast. UFI uses it to sort millions of questions onto the map, and AI engines use it to decide which pages to read and cite.
Inside: retrieval sorts demand onto the map
01
Collect
Records with source, role and date
02
Embed
Each record becomes a vector
03
Retrieve
Nearest nodes on the map
04
Decide
A model picks one, or none
05
Check
Gold sample and review queue
06
Map
Entity, intent, persona, stage
Classification at scale, in two passes: retrieval narrows each record to a few candidates, then a model makes the call.
Embeddings turn each question, review and post into a vector, and a vector index finds the nearest nodes of the ontology in milliseconds. The expensive step, a model's decision, runs only on a handful of candidates, with the graph supplying each node's definition, neighbors and examples. This is retrieval-augmented generation turned inward (Lewis et al., 2020): the pattern that grounds a chatbot in documents grounds a classifier in an industry map, and graph-based retrieval extends it to questions about the whole corpus (Edge et al., 2024). Sort into a map you designed rather than clustering: clusters describe the data you happened to collect, not the industry.
Outside: AI engines retrieve before they answer
What the person asks
Which three-row SUV is best for a family with two car seats?
One question from one parent
What the engine searches for
three-row SUV third-row legroom for adults
car seat fit, three-row SUV, LATCH positions
hybrid three-row SUV real-world fuel economy
three-row SUV owner reviews, common problems
best time of year to buy a three-row SUV
three-row SUV insurance cost for a young family
Query fan-out, illustrated: the kind of sub-searches an engine issues for one question. Examples, not a capture of any engine's real queries.
Google describes its AI Mode as using a query fan-out technique: it breaks a question into subtopics and issues many searches at once on the person's behalf (Google, 2025). A brand is chosen by the sub-questions, not only the head question, and each engine reads different kinds of sources, so map how each need fans out (try the Fan-out Journey) and measure presence answer surface by answer surface.
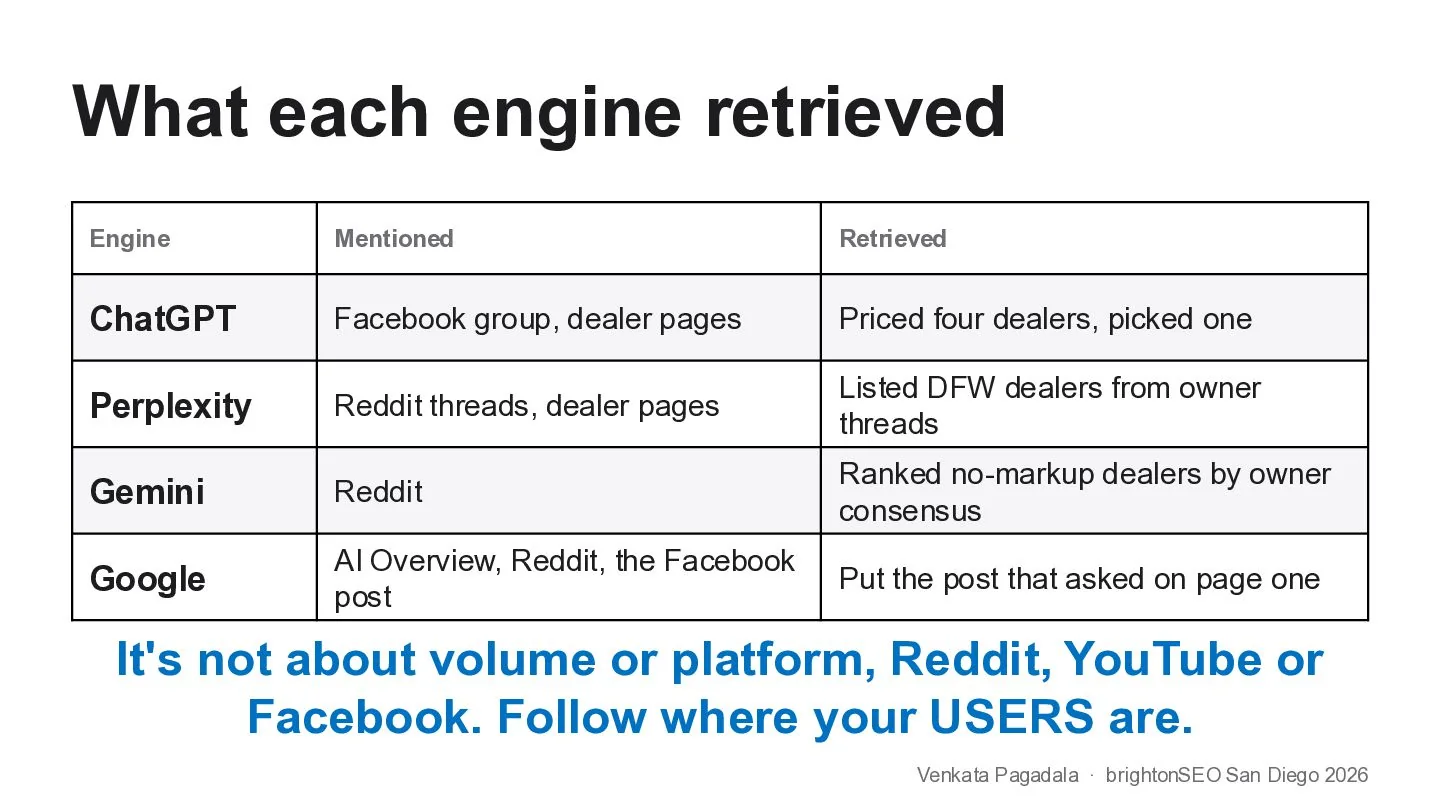
My own question about a car, asked of four engines in 2026. Each one went to different sources before answering: a Facebook group, Reddit threads, dealer pages. One engine's result says little about the others.
Answer surface
An answer surface is where a person receives an answer: a results page, an AI Overview, a chat assistant, a video, a marketplace listing or a store page.
AI answer engines retrieve and cite different kinds of sources, so the same need can be won on one surface and lost on another. UFI measures presence surface by surface instead of assuming one ranking stands for all.
- Analogy
- The different counters where a customer can be served.
- Example
- A brand cited in Google's AI Overviews for a need can be absent from a chat assistant's answer to the same question.
- In the framework
- Steps 4 and 5.
Technical deep dive: two-pass classification in code
# Pass 1: retrieval narrows each record to a few candidate nodes
q = embed(record.text)                        # one vector per record
candidates = index.search(q, k=8)             # cosine similarity over node vectors

# Pass 2: a model decides, with the graph's context and a fixed output schema
context = [graph.describe(node) for node in candidates]   # definition, neighbors, examples
label = llm.classify(
    text=record.text,
    candidates=context,
    schema={
        "node": "one of the candidates, or NONE",
        "intent": ["research", "compare", "purchase", "support", "navigate"],
        "confidence": "0 to 1",
        "reason": "one sentence",
    },
)

# Quality: agreement with a gold sample labeled by people
kappa = cohen_kappa(gold.labels, model.labels) # report with n and an intervalCosine similarity, cos(q, n) = q·n / (‖q‖ ‖n‖), ranks the candidates. Allowing NONE stops forced labels; rejected records go to a review queue, and recurring rejects show where the map needs a new node. Cost stays flat as the ontology grows, because the model only ever sees the few candidates retrieval hands it.
How do you find the gaps that matter?
In plain words
A gap is something people clearly need that nobody answers well where they look. Find them by comparing demand with what you, your competitors and the best answers already cover.
Maintain or prune
Well answered, little need. Keep it accurate; do not invest more.
Defend
Big need, well answered. Keep it fresh and watch the competitors.
Watch
Little need, little coverage. Early signals can move it right.
Close the gap
Big need, poorly answered. This is where to build, publish or fix first.
How much people need it →
The gap matrix: every node on the map lands in one quadrant, per answer surface.
Gaps are an outcome of query discovery, the framework's first task: find the questions people ask about the industry's entities, on any surface and in their own words, before deciding which to answer. A Content Gap Score turns the comparison into a ranking; its open reference implementation is published on GitHub.
Evidence 1: who AI answers cite
348,450
prompts in one topic
372,853
AI answers read
22.8%
of citations went to third-party platforms
19.9%
went to the 15 leading brands combined
Who gets cited
Third-party platforms
YouTube, Reddit, Wikipedia, Medium, LinkedIn, Stack Overflow, Google
The 15 leading brands
brands masked
Brand pages outside the tracked set
Everything else
the long tail of sites
Third-party sources
YouTube
Google's own pages
Wikipedia
Medium
LinkedIn posts and articles
Stack Overflow
Brands (masked)
Brand A
Brand B
Brand C
Brand D
Brand E
Brand F
Brand G
Brand H
Brand I
Brand J
Brand K
Brand L
Brand M
Brand N
Brand O
YouTube alone took 12.4% of all citations, twice the leading brand's 6.2%, and third-party platforms together out-cited the 15 leading brands combined. Be present where the engines read: the video, the community answer and the reference entry, not only your own pages. Brand names are masked; the platforms are named because they are the finding.
About this data
One topic in an online learning vertical, U.S., all AI platforms in the index, non-brand prompts. Shares are of all cited sources, computed 22 September 2026 from a commercial AI-citation index for the author's research. Treat it as one topic's picture, not a law.
Evidence 2: what customers praise and what they complain about
47,485
store reviews
37,193
with text (78%)
33.7%
top praise: helpfulness
4.4%
top complaint: rude staff
Topics
Customer service
Helpfulness
Store experience
Phone or device
Staff quality
Friendliness
Plan or account
Online or app
Billing and payments
Recommendation
Promotions
Activation
Share of reviews with text that mention each topic, with those reviews' average star rating.
Praise
Helpfulness
Customer service
Friendly staff
Knowledgeable
Highly recommended
Fast service
Patient staff
Professional
Problem resolved
Good experience
Complaints
Rude staff
Long wait
Poor service
Misleading information
Pushy sales
Billing issues
No resolution
Store issues
Poor communication
Coverage issues
Complaints are rare but severe: each bar is a small share of reviews, and most of those reviews average below 2.5 stars.
The top complaint, rude staff, appears in 4.4% of reviews, and those reviews average 1.91 stars; long waits appear in 2.8% and average 2.39. No blog post fixes a wait. Fix the experience first: digital check-in and in-app appointments, then a page that tells people what to expect and how to book. Reviews of one U.S. telecom retailer's stores; the retailer is not named, and themes were assigned by a classifier, several per review where they apply.
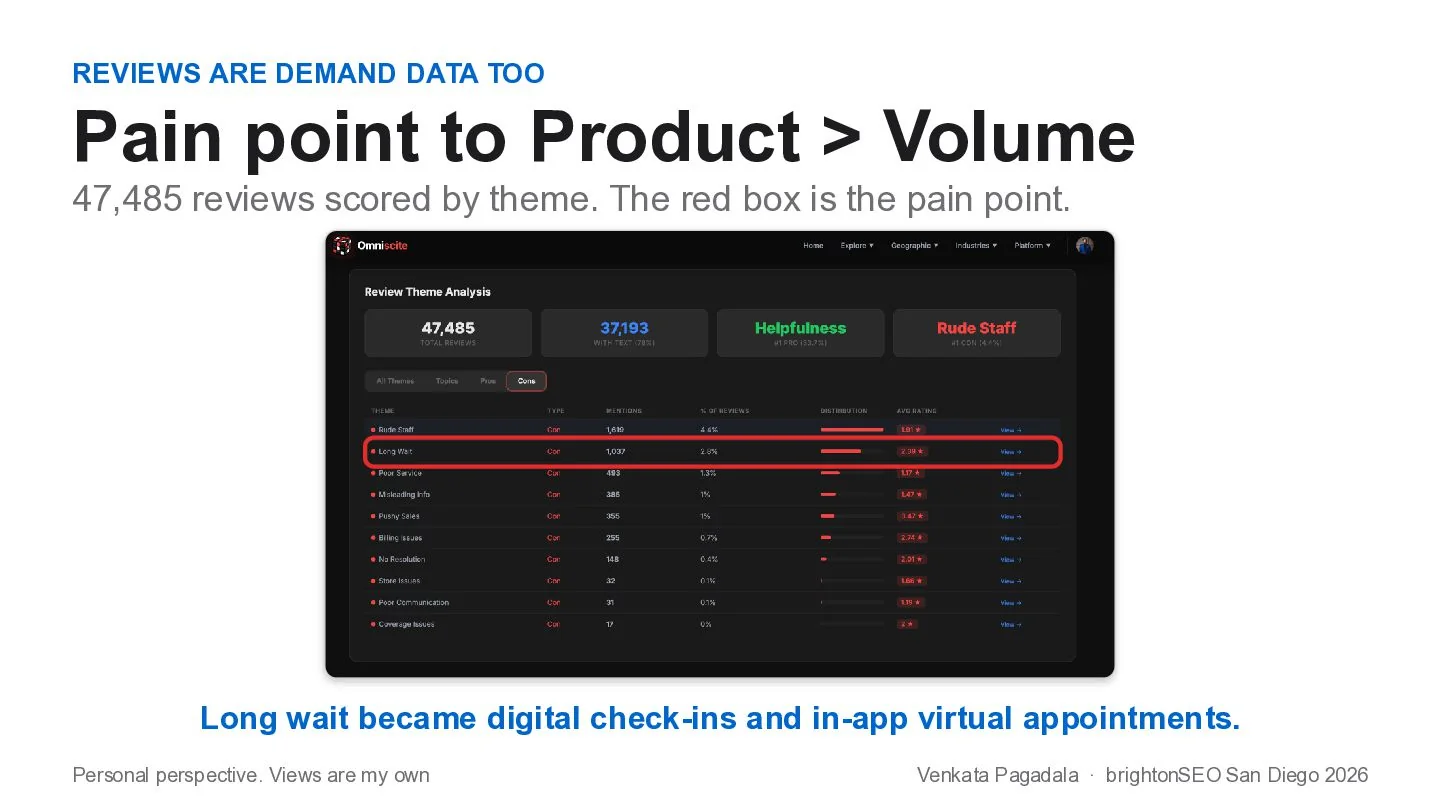
The same review themes as I presented them, with the long-wait row boxed: the pain point became two product ideas, not an article.
“None of the traditional tools tell a problem or pain points, but analyzing and classifying data tells that.”
Technical deep dive: the Content Gap Score
The score ranks entities on the map. Every term comes from one source role, so coverage can never pose as demand, and reported search volume is not an input at all.
prior(e) = β·rel(e) + (1 − β)·dem(e)
CGS(e)   = prior(e) · (1 − own(e)) · [ α·(1 − cov_K(e)) + (1 − α)·mean_q(1 − ans(q,e)) ]

rel(e)    topic-sensitive PageRank over the structure graph, rank-normalized    (structure)
dem(e)    rank-normalized count of user questions linked to e                   (demand)
own(e)    the organization's own coverage, graded 0, ½ or 1                     (coverage)
cov_K(e)  mean of the same grade over the competitor set K                      (coverage)
ans(q,e) whether the web answers competency question q about e (answerability)α moves weight between the two deficits; β between structure and demand. The first bracket term is the instance gap (nobody covers this entity), the second the schema gap (nobody answers this question about it); they are reported separately because they call for different content. The score is a specification: no published study has yet tested what it predicts.
How do you see where the audience is moving?
In plain words
Audiences move from one platform to another, sometimes in a year. A snapshot hides it; watching the same numbers over time shows it early.
India: monthly visitors, millions
comScore, 2010: Facebook took the top spot in July 2010.
U.S. teens who use each site
Pew Research Center, 2024: teens aged 13 to 17.
UFI watches the persona and platform links over time, and a short list of early signals:
Signal
New words
Terms that appear in people's questions before any tool reports volume for them.
Signal
Rising mentions
A product, a problem or a platform named more often in communities and reviews.
Signal
Entrants from below
Cheaper, simpler offers that start with customers the leaders ignore: Clayton Christensen's disruptive innovation.
Signal
Convergence from beside
Products from an adjacent market that start to answer the same need, the way the phone absorbed the camera.
Signal
Company moves
Earnings calls, job postings and patents that show where competitors are investing.
Signal
Answer drift
AI engines that start citing different sources for the same need.
“It's a moving target. You need to find where your users are spending the most time.”
Audience migration
Audience migration is a lasting shift in where a group spends time, asks questions or trusts answers, from one platform or channel to another.
Snapshots hide it and series reveal it. UFI tracks persona and platform links over time and watches early signals: new terms, rising mentions, entrants from below and convergence from adjacent markets.
- Analogy
- A river that changes course one season at a time.
- Example
- In India, Facebook passed Orkut in monthly visitors in July 2010; among U.S. teens, Facebook use fell from 71% in 2014-15 to 32% in 2024.
- In the framework
- The loop.
What happens when every result is personal?
In plain words
Your results are not my results, and AI answers change even between two tries. So stop chasing one position, and know your people well enough to be present wherever their answers come from.
Search results already vary from person to person, and AI answers vary more. A 2013 audit of Google found that personalization changed about 11.7% of results on average, driven mainly by being signed in and by location (Hannak et al., 2013). AI assistants compose their answers instead of ranking pages: ask the same question twice and the answer, and its sources, can change, and researchers at OpenAI found that a chatbot's responses can differ with nothing more than the user's name (Eloundou et al., 2025). As assistants remember more about each user, that variation will grow.
“What your tools see is not what your users see.”
Before
What a rank tracker sees
- One query, one phrasing
- One location, signed out
- One results page, one position
- A snapshot of a moving target
User-First Intelligence
What User-First Intelligence measures
- Each persona's questions, in their own words
- Every engine and surface they use
- Presence and citations across repeated runs
- Outcomes: tasks finished, sales, customers kept
Here is where I think this goes. These are predictions, not findings:
Prediction 1
Position will matter less, presence more
When every result is personal there is no single rank to win. What a brand controls is whether it is present, and trusted, in the sources each engine reads for each persona.
Prediction 2
Optimize for the persona, not the position
The stable unit is not a keyword at rank three. It is a need, held by a persona, on a platform, and it survives personalization because it describes the person.
Prediction 3
Personal agents will standardize demand, not end it
When people hand tasks to their own agents (a flight that lands before noon, a checked bag, under $500), the agents ask in patterns their principals set. Needs repeat across a persona. Publish offers an agent can verify.
Prediction 4
Measurement moves to panels and outcomes
Teams will sample answers through persona panels, prompts in each persona's words run across engines, and judge success by completed tasks and revenue.
“Agents gather. People decide.”
I built an AI agent that does 60 to 70% of my job.
Read what I said
“I have a great mentor who I work with, his name is Gene. He challenges me every time. Okay, this is great. How can this be used by 10,000 people at the same time? So, I created a multi-level AI agent orchestration, where they can talk to each other. I was able to build a great agent that can 60 to 70 percent do my job.”
How I run it today: declared agents, each with a role, sources and checks, doing most of the gathering and classifying, and a person verifying what they produce. The percentage is my own estimate of my own work, not a benchmark.
Technical deep dive: measuring answers when results are personal
- ·Build a persona panel. For each persona and need, write prompts in that persona's own words (from the demand log, not from a keyword list), with the context they would give an assistant.
- ·Repeat runs. Run every prompt on every engine several times; a single run of a generative answer is an anecdote.
- ·Measure presence with an interval. Presence rate = runs that cite you ÷ runs; report a Wilson interval so small panels do not overclaim.
- ·Measure stability. Jaccard overlap of cited domains between runs and between engines, J(A, B) = |A ∩ B| ÷ |A ∪ B|, shows how much the answer moves.
- ·Watch drift. Re-run the same panel on a schedule; a falling presence rate with a stable panel is answer drift, not a change in demand.
How do you run a User-First Intelligence study?
In plain words
Seven steps from a business question to a decision. A small business can do it in a week with a spreadsheet; a large one runs it continuously with agents.
Step 1
Frame the decision and write the questions first
Decide what the study must inform (a content plan, a product, a market entry) and write the competency questions the map must answer before collecting any data.
Step 2
Define the personas and grade the evidence
Record each persona's situation, tasks, constraints and channel habits, and mark every trait measured, derived or inferred.
Step 3
Map platforms and attention
For each persona, note where it spends time, where it asks and where it trusts answers. Use survey data as the prior and your own analytics as the check.
Step 4
Collect demand in people's own words
Pull questions, posts, comments, reviews and queries from the platforms on the attention map, keeping each record's source, role and date. Keep competitors' coverage apart from demand.
Step 5
Classify everything onto one industry map
Place each record by entity, need, intent, persona and journey stage. Let AI agents do the first pass, check a gold sample by hand and fix the map where it fails.
Step 6
Compare demand, supply and competitors to find the gaps
For every node, compare the need with your coverage, your competitors' coverage and the quality of the best available answer, surface by surface, and rank the gaps by value and effort.
Step 7
Decide, ship, measure and refresh
Choose what to build, publish or fix, in which format and on which platform. Measure completed tasks and business outcomes, re-run the collection on a schedule and watch where people move.
“When you're working for an enterprise, you need to build a system at scale that can be used by multiple users.”
Worked example: evidence-graded personas on this site
In plain words
Every line on a persona says how sure we are: measured by a study, borrowed from a wider group, or just an assumption to test.
Persona
US man, 30 to 49, young family, in-market for a 3-row SUV
- Reachable on YouTube92% of 30-49s ever use it, the second-highest of any age group
- Facebook is not dead for this cohort80% of 30-49s use it, the HIGHEST of any age band, above 18-29s at 68%
- Instagram reaches most of them62% of 30-49s
- Reddit is a real channel here, TikTok bigger than assumedReddit 35%, TikTok 44% of 30-49s
- Wants a hybrid buying process, not a fully online one63% say omnichannel would be ideal; only 28% want all-online, and just 7% actually bought that way
- Still ends up at the dealership53% completed every step in person
- Attention is concentrated in videoTikTok about 95 min/day, YouTube about 75, Facebook about 33
- Open to AI in the buying process83% of recent buyers expect AI to reshape car buying within a decade
- Trusts current owners over dealer marketingCommonly assumed, not established here
- Behaviour changes because he has an infantNo public dataset cuts platform use by parental status or child age
- Avoids owner groups after purchase, uses them beforeNo evidence either way
Notice the inferred lines. My own story (trusting owners in a Facebook group over sales pages) is one person's experience; on the card it stays an assumption until a study measures it. That is the point of grading.
The personas on this site are built this way, from 3 named studies with published methods, samples and field dates: 6 traits measured and 3 inferred, shown rather than hidden. Behind them, the Global Persona Framework (version of 23 September 2026) lists 463 dimensions in 42 families, and states its own rule: identity does not determine behavior or interests. The Persona Builder turns the framework's questions into a brief, and the Fan-out Journey shows one persona's need becoming dozens of questions across a purchase.
How do you measure User-First Intelligence?
In plain words
Measure what changed for people and for the business first. Rankings still count where they exist; they are no longer the scoreboard.
Outcomes
Tasks, sales, customers kept
Qualified visits, leads, sales and retention, traced to the decisions the study produced.
Coverage
Priority nodes answered well
The share of priority nodes you answer well, per answer surface: results, AI answers, video, communities, reviews.
Map quality
Questions the map can answer
The share of competency questions the ontology can express, and the share the graph actually answers.
Classification
Agreement with people
Agreement with a gold sample checked by people, reported with its sample size.
Evidence
Measured, not inferred
The share of persona traits and claims that are measured, and how old the evidence is.
Instruments
One figure per instrument
Volume and traffic estimates from different tools are different models. Compare like with like and never mix them in one chart.
Where did User-First Intelligence come from?
In plain words
From a decade of search work and a habit of starting with the user, written down in public along the way.
August 2024
User-First Optimization
I described programmatic SEO as UFO, User-First Optimization, plus rich data, plus scaled implementation: what value do you give the user that is better than your competitors?
April 2025
Users stay constant
UFO became my stated strategy: algorithms, devices and results pages come and go; users stay constant, whether the engine is a search engine or an answer engine.
September 2026
User first, algorithm second
At brightonSEO San Diego I presented Industrial Level Classification with Intent: industry-wide demand research connecting queries, including zero-volume ones, to personas, intent and pain points. The slides, the write-up on Previsible and a recap post are public.
October 2026
User-First Intelligence, named and specified
The framework took its name, and an open reference implementation of its Content Gap Score was published on GitHub.
23 October 2026
This reference guide, version 1.0
A research paper and a book on User-First Intelligence are in preparation. Until they are out, this page is the framework's public reference; it is versioned, and changes will be noted here. UFI is my independent work, not a product or a position of my employer.
The recording of that talk, photos from the room and what people in the field said about it are at the top of this page.
How does User-First Intelligence relate to existing ideas?
In plain words
It stands on decades of well-tested ideas and combines them into one working system.
1986
User-centered design
Norman and Draper put the user at the center of system design. UFI applies that stance to demand research and content.
1999
Personas
Alan Cooper made users concrete for product teams. UFI grades every persona trait by its evidence.
2002
A taxonomy of web search
Broder separated navigational, informational and transactional searches: intent, classified.
2010
People ask their networks
Morris, Teevan and Panovich showed people put questions to their social networks, not only to search engines.
2012
Market structure from text
Netzer, Feldman, Goldenberg and Fresko mapped a market's structure from forum text.
2014
Competency questions
Ren et al. used competency questions to decide what an ontology must answer.
2016
Jobs to be done; competition from search data
Christensen, Hall, Dillon and Duncan asked what a customer hires a product to do; Ringel and Skiera mapped competition among more than a thousand products from search data.
2019
Customer needs from user-generated content
Timoshenko and Hauser found customer needs in user-generated content with machine learning.
2024
Generative engine optimization
Aggarwal et al. studied how sources gain visibility in AI-generated answers; Google's people-first content guidance points the same way.
2026
User-First Intelligence
The combination, run as one system: a designed industry map every demand source lands on; evidence with roles and grades; persona, platform and format decided together; agents at scale; and a loop that watches where people move.
Where can you watch, read and try User-First Intelligence?
In plain words
Recorded conversations where I work through these ideas, tools on this site that run parts of the method, and the papers behind it.
Conversations about the ideas
Rethinking SEO for LLMs and Personalization
With host Tyson Stockton: how enterprise search is changing with LLMs. Mining first-party data and zero-volume queries, building topic hierarchies, and getting ready for personalized search and query fan-out.
Closest to this guide's sections on zero-volume demand and personalization.
How to Find What AI Search Trust
Episode 302: the SEO data most teams are missing, and finding demand beyond Google.
Closest to the twenty demand sources: finding demand beyond Google.
Enterprise AI SEO: Automation Pipelines, MCPs, and Future Proofing
How enterprise teams ship automation pipelines for metadata, schema and content drafts, classify queries at scale, and earn inclusion inside LLM answers.
Closest to the industry map: classifying queries at enterprise scale.
Building AI Agents for Marketing Functions with Venkata Pagadala
A session for marketers on building AI agents: how agents differ from scripts and workflows, when one agent is enough and when a multi-agent system makes sense, and how to test, measure and guard agents before scaling them.
Closest to the rule that agents gather and classify while people decide.
Each player loads from YouTube only when you press play.
Tools you can use today
The LinkedIn knowledge graph above is one live tool. These four run the persona side of the method, in your browser, on public data.
 Persona BuilderAnswer the framework's follow-up questions and grade the evidence for each answer as you go. You get a persona brief with no invented biography.Build a persona →
 Persona Fanout JourneyOne starting query, fanned out by persona scenario and by every stage of the buyer's journey. Every question says which inputs produced it and how to check it.Fan out a query →
 Global Persona FrameworkThe classification library behind the personas: 463 dimensions in 42 families, each with its definition, its follow-up question and the evidence a value needs.Browse the framework →
 Audience PersonasPersonas where every trait is graded measured, derived or inferred, and links to the study behind it. Build anyone and see where they actually are.See the personas →
Research papers
- PreprintSSRN · 2026 · Sole authorThe Disruption of Search Engine Optimization by Large Language Models: A Mixed-Methods Analysis of the Evolving Search Landscape ↗
A mixed-methods study of what large language models are doing to search behavior, and what that means for how content gets found.
- Peer-reviewedJournal of Digital & Social Media Marketing · 2024 · Co-author, 2 of 2Google, SEO and Helpful Content: How Artificial Intelligence Can Be Helpful for E-Commerce Websites ↗
How AI supports the helpful-content standard on e-commerce sites, from product data quality to editorial signals.
- Peer-reviewedDiscover Artificial Intelligence · 2026 · Co-author, 4 of 5A survey of reward hacking in agentic large language model systems ↗
A four-level taxonomy of how tool-using AI agents game their rewards, from verbosity and sycophancy up to modifying tests and disrupting monitors, compared across RLHF, RLAIF, RLVR and DPO, with a layered defense model for production systems.
Frequently asked questions about User-First Intelligence
What is User-First Intelligence?
User-First Intelligence (UFI) is a framework, created by Venkata Pagadala, for understanding demand from people outward: who they are, where they spend time and ask for help, what they need in their own words, and how that maps to an industry, so a business decides what to build, publish or fix for each audience.
Who created User-First Intelligence?
Venkata Pagadala, a search and AI product leader and researcher. It grew out of his User-First Optimization posts in 2024 and 2025 and his brightonSEO San Diego 2026 talk, with the line "user first, algorithm second", and he named and specified it as User-First Intelligence in October 2026.
Is User-First Intelligence the same as SEO?
No. SEO makes pages easy for search engines to find and show. UFI decides which needs matter, for whom and where, before any optimization. SEO, GEO and AEO are among its outputs, and it also produces decisions about video, communities, products and service.
Does zero search volume mean zero demand?
No. Search volume is a tool's estimate for one phrasing, one market and one period. People often express the same need in communities, reviews, videos and AI assistants before, or instead of, typing a countable query. Zero volume is a reason to look elsewhere, not a verdict.
What data does User-First Intelligence use?
Twenty demand sources in five groups (search and language, social conversations, customer experience, market context and expert knowledge), plus the answer surfaces where people receive answers. It works from public, licensed and consented data, in aggregate, and keeps the source, role and date of every record.
Do I need a knowledge graph to start?
No. Start with a one-page map: your industry's main categories, the needs under each and the personas who hold them. A graph pays off when sources, markets and competitors multiply and you need to connect them.
How does User-First Intelligence handle AI search?
AI assistants are both a demand surface and an answer surface. UFI maps the sub-questions an engine fans a question out into, measures presence and citations engine by engine, and treats vendor figures for AI prompt volume as models to check, not counts.
How do you target an audience when search and AI results are personalized?
Target the unit that personalization does not change: a need, held by a persona, on a platform. Be present and trusted in the sources each engine reads for that persona, and measure outcomes instead of one tracked position that no customer sees.
Will personal AI agents make demand research obsolete?
No. Agents will ask on behalf of people, in patterns their principals set, and those needs and constraints repeat across a persona. Knowing the patterns, and publishing offers an agent can verify, becomes more valuable, not less.
Can a small business use User-First Intelligence?
Yes. Pick three personas, five sources and a one-page map, run the seven steps in a week, and act on the top three gaps. The method scales down; only the tooling grows.
Is User-First Intelligence ethical?
It is designed to be: public, licensed and consented data only, in aggregate; private conversations are never a listening feed; personas are graded by evidence; and identity is never used to decide what a person is offered or denied.
How do I cite User-First Intelligence?
Pagadala, V. (2026). User-First Intelligence (UFI): A framework for understanding people before algorithms (Version 1.0). venkatapagadala.com. https://venkatapagadala.com/guides/user-first-intelligence
How to cite User-First Intelligence
Cite this framework
Pagadala, V. (2026). User-First Intelligence (UFI): A framework for understanding people before algorithms (Version 1.0). venkatapagadala.com. https://venkatapagadala.com/guides/user-first-intelligence
@misc{pagadala2026ufi,
  author       = {Pagadala, Venkata},
  title        = {User-First Intelligence (UFI): A Framework for Understanding People Before Algorithms},
  year         = {2026},
  month        = oct,
  note         = {Version 1.0. Reference guide},
  howpublished = {\url{https://venkatapagadala.com/guides/user-first-intelligence}}
}Quote the one-sentence definition with attribution and a link to this page. When the paper and the book are published, their details will be added here.
Sources & further reading
900 U.S. adults' browsing, March 2025: AI summaries on 18% of searches; result clicks 8% with a summary, 15% without.
Platform use by age, the source of the table above.
Facebook use among U.S. teens: 71% in 2014-15, 32% in 2024; X: 33% to 17%.
July 2009 to July 2010: Facebook 7.5 to 20.9 million monthly visitors; Orkut 17.1 to 19.9 million.
The 40% lunch-search remark and Google's note that it came from a survey of U.S. users aged 18 to 24.
Describes the query fan-out technique.
Go deeper